
The Zetasizer range of instruments measures the hydrodynamic size of molecules and particles by dynamic light scattering. The Zetasizer APS and μV are aimed primarily at life science applications. To improve functionality in these applications, a new analysis algorithm - Protein Analysis - has been introduced into the Zetasizer software.. This analysis method is suited to protein applications where samples typically consist of narrow peaks at small sizes often with aggregates. This technical note describes the protein analysis and how it differs from the general purpose and multiple narrow modes algorithms.
All the analyses actually perform two size calculations. In each case the cumulants calculation as described by ISO22412, for measuring the Z-average mean is performed and is the same in each analysis. The second, a distribution calculation, is then performed, which is the part that varies between analyses.
The distribution analysis fits multiple exponential decay rates to the derived correlation function in order to assess the contribution of different size populations to the overall function. It is this calculation that is used to generate the Intensity Particle size distribution (PSD). This calculation is performed using a non-negative least squares analysis (NNLS) analysis.
Without prior knowledge of the components of a sample, the number of possible solutions to a NNLS analysis is infinite.
An appropriate solution must be chosen. Any choice is a compromise between how closely the solution fits the measured data and how much smoothing it undergoes to give a reasonable answer. A close fit will provide greater resolution and provide more discrete peaks in the solution; however, there is a high likelihood that the solution will include noise from the measurement that will add false peaks to the Intensity PSD. On the other hand, a smooth fit will be less affected by noise but at the cost of resolution, producing broader more rounded peaks.
In the Zetasizer software, the general purpose and multiple narrow modes algorithms both choose a solution using fixed analysis settings. General purpose produces a smoother fit and is recommended for most unknown samples. Multiple narrow modes fits the data more closely to produce sharper, more resolved peaks and is recommended for samples that are known to contain multiple populations with low polydispersity.
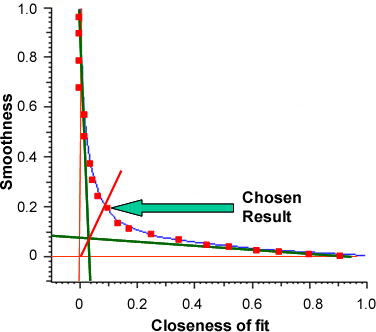
The protein analysis does not have a fixed setting to apply to all data. It fits 20 different solutions to find the most appropriate for a given dataset. This fitting is related to the quality of the data so that good data will have a solution that fits more closely whereas poor data will have to undergo more smoothing. It increases smoothness at a cost of closeness of fit and vice versa. A plot of 'Smoothness' against 'Closeness of fit' is an exponential curve in the shape of an L, from which the analysis' original name, L-curve, is derived.
Of the 20 different solutions, the best compromise between these two parameters is the chosen result. This is selected by drawing tangents from the exponential trajectories at either end of the L-curve back to the axis. The solution that is closest to the intercept of these two tangents is chosen as the best solution (figure 1).
|
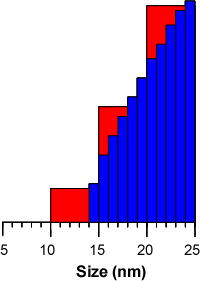
The other significant difference between the protein analysis and the other distribution algorithms is the number of size classes contained within a result. The protein analysis includes 300 separate exponentials and size classes in its analysis whereas general purpose and multiple narrow modes use 70.
The main effect of this is that small numbers of molecules at the edges of peak do not serve to artificially broaden the peak by filling size classes that extend beyond the actual limits of the peak. For instance, a group of molecules that measure 14 nm in size may be included in a group that includes the size range 10-15 nm in the general purpose and multiple narrow modes analyses. This has the effect of making the peak edge appear to end at 10 nm leading to tailing. Since the protein analysis contains more size classes, the peak edge will be closer to the actual size limit of the particles within the population, for instance 14 nm in the above theoretical example (figure 2).
|
As every set of data is different, varying the analysis settings accordingly allows the calculation to, essentially, reward good data with narrower, more representative, peaks while at the same time, providing a smooth solution for lower quality data.
Since protein samples typically consist of small narrow peaks and separate populations of aggregates the narrow peaks derived by the protein analysis algorithm are, therefore, more appropriate for describing these samples.
The protein analysis has been added to the Zetasizer software. While the Z-average value remains the same, in line with ISO22412, the protein analysis algorithm has been added to the distribution analysis options to make it more appropriate for such samples. By considering multiple solutions, the algorithm can choose the most appropriate for a given dataset.