When a particulate system contains particles of different types it may be necessary to know the proportions of each particle type within a sample. To this end, the Morphologi® G3 Particle Characterization System offers the ability to be able to classify particles according to combinations of the morphological parameters that it measures. The scattergram feature (Figure 1) aids visualization of particles when setting up such classifications by plotting any morphological parameter against any other one so it can be seen how they relate with each other. This application note will demonstrate how the scattergram can be used to visualize data and set up classifications.
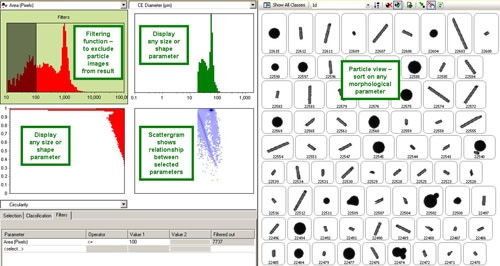
A simple particulate sample has been measured on the Morphologi G3 System. The sample was a mixture of rods and spherical particles which were analyzed according to a standard operating procedure (SOP). Every particle image is saved by the system and can be viewed in the particle view section of the scattergram tab (Figure 1).
In addition to the particle images, this tab also displays morphological distributions, the classification and filtering functions and the scattergram itself. The distribution in the top left allows simple filtering of particle images that the user does not wish to include in the result. For this example we are interested in the shape of the particles and thus all particle images which contain less than 100 pixels, and therefore limited shape information, are filtered from the result. Any morphological parameter distribution can be displayed in either of the distribution graphs (top right and bottom left). The scattergram (bottom right) then shows the relationship between the two parameters selected.
|
Each pixel in the scattergram is intensity coded to represent the proportion of particles with that particular combination of the two morphological parameters selected. The deeper the intensity of the blue color, the higher the proportion of particles.
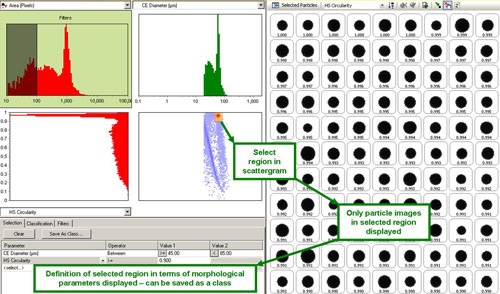
When a region of the scattergram is highlighted, the particle view shows only the particle images in that region (Figure 2). The definition of the highlighted region, in terms of the parameters selected, is displayed in the selection tab and can then be saved as a class by pressing the "Save As Class" button. Either of the distribution graphs can then be changed to present the distribution of another parameter to further refine the rules for a class if required.
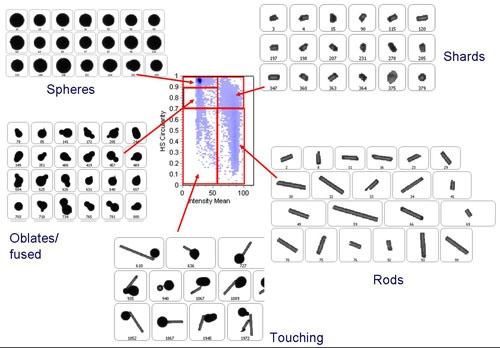
For this example an interesting scattergram was displayed when the intensity mean was plotted against high sensitivity (HS) circularity. It enabled the different types of particles to be separated well as shown in Figure 3. When the individual regions of the scattergram were highlighted the descriptions for each one were saved as separate classes and thus a classification for the whole sample was established.
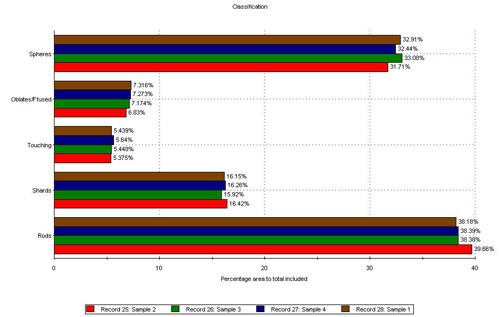
Such classifications can then be added to the original SOP and so can be applied directly to all future measurements. Results of the classification in terms of proportions of the various types of particles are displayed in a classification report and different samples can be easily compared by overlaying the results for each as shown in Figure 4.
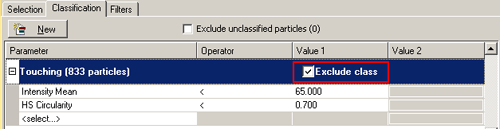
The classification feature can also be used as a sophisticated filter function. In this example the touching particles class could be excluded from the final result by simply ticking the "Exclude class" check box Figure 5.
|
|
|
|
The scattergram tab feature of the Morphologi G3 Particle Characterization Software allows easy visualization of how the various morphological parameters relate to each. Selecting regions of the scattergram results in only particle images in that region being displayed thus classifications can easily be established and results from different samples quickly compared.
