
The calculation of size distributions using laser diffraction requires users to specify the optical properties of the sample being analysed. Here we describe how image analysis can be used validate optical property selections.
It has long been understood that in order to obtain accurate results using the technique of laser diffraction, users need to know the optical properties of the materials being tested. ISO133201, the international standard for laser diffraction, explains that when measuring particles which are less than 50 microns in size, realistic values for the refractive index of the particle and dispersant phases must be known along with the imaginary refractive index (absorption) of the particles. This requirement for optical properties becomes increasingly important as the refractive index difference between the particle and the dispersant decreases. In the case where the refractive index contrast is low, significant errors can be observed even when sizing particles greater than 50 microns in size if incorrect optical properties or simpler analysis models such as the Fraunhofer Approximation are used.
In this study the technique of image analysis has been used to verify the laser diffraction results obtained for an agarose bead sample. Image analysis provides a good technique against which the results obtained using laser diffraction can be correlated, particularly when the fine particle fraction reported by laser diffraction needs to be verified. In addition, direct imaging of the particles can allow for an assessment of the optical properties, allowing the correct settings to be used within the laser diffraction analysis.

|
Porous agarose beads are employed as a packing material in gel filtration chromatography columns used for the purification of proteins and other macromolecules in biotechnology applications. The size of the beads is important in determining how the beads pack together within the chromatography column and therefore the elution time for different macromolecules. Decreasing the particle size can increase elution times and improve the overall resolution obtained during separation, as the surface area available for absorption is increased. The size of the pores present within the beads is also important as this affects the molecular weight range of the macromolecules which can be separated.
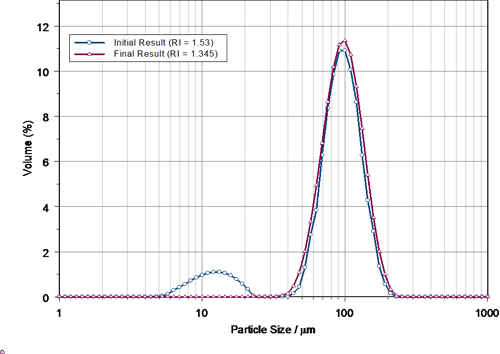
The Mastersizer laser diffraction system was used to verify the particle size distribution for a specific grade of agarose beads (figure 1). The agarose beads were dispersed in deionised water. A refractive index of 1.52 was used in the analysis of the diffraction data as this was known to be in the mid-range of refractive index values for polysaccharides. The size distribution of the beads was expected to be narrow. However, the laser diffraction results suggested that two peaks were present - a narrow mode at around 100 µm in size and a second broader mode at finer particle sizes (figure 2). The presence of the fine mode was not expected given the process conditions used to produce the agarose beads.
|
|
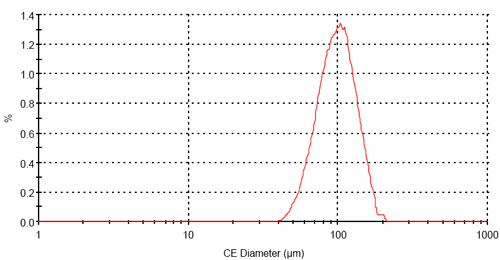
The agarose sample had been provided as an aqueous dispersion. A small volume of this dispersion was therefore placed on a microscope slide. This slide was then scanned using the Morphologi automated image analysis system. The images obtained confirmed the presence of spherical beads (figure 1). Analysis of the size of almost 1000 particles showed that the size distribution was relatively polydisperse (figure 3). However, no particles less than 40 microns in size were detected. As image analysis is very sensitive to detecting fines within a particle size distribution, this evidence suggested that the fine mode reported in the initial laser diffraction results was not present within the sample. Instead, it was believed that the reporting of this mode was caused by the use of incorrect optical properties within the laser diffraction analysis.
The images obtained for the agarose beads can help in configuring the laser diffraction analysis. As can be seen in figure 1, the contrast between the particles and the aqueous dispersant is very low. When particles overlap, the particles positioned furthest away from the optics can still be seen to be perfectly spherical. Both of these observations suggest that that the refractive index contrast between the agarose beads and the dispersant is low. This is perhaps not surprising as the beads are designed to be extremely porous. A significant amount of water will therefore be absorbed within the particles, thus reducing the effective refractive index of the particulate phase.
Based on the observations described above, the laser diffraction data obtained for the agarose beads was reanalyzed using an optical model where the particle refractive index was much lower compared to the initial selection described above (1.345 compared to 1.52). The image in figure 1 also confirms that the particles are spherical and transparent, thus an imaginary refractive index of zero should be used. Using these optical properties yields the second of the laser diffraction results shown in figure 2, where the mode of fines is no longer reported. In addition, agreement between the diffraction data collected for this sample and the theoretical scattering data relating to the calculated result is much better, as assessed by the analysis residual (0.78% residual compared to 1% for the initial results). Good agreement with the volume distribution reported using image analysis results is also obtained (table 1), with the differences observed being related to the small number of particles counted during the image analysis study in this case.
Table 1: Comparison of the laser diffraction and imaging results.
System | D(v,0.1)mm | D(v,0.5)mm | D(v,0.9)mm |
Mastersizer | 65.03 | 93.09 | 131.10 |
Morphologi | 70.18 | 99.31 | 135.3 |
The results described here show the importance of using the correct optical properties when carrying out particle size analysis using the technique of laser diffraction, especially when the difference in optical properties between the particle and dispersant phases is small. Observations made using image analysis allow the analysis settings used in the laser diffraction analysis to be validated, enabling accurate results to be obtained.
[1] ISO13320 (1999). Particle Size Analysis - Laser Diffraction Methods. Part 1: General Principles.