Seasoned Archimedes instrument users are all too familiar with the “Sneeze”, that whooshing sound accompanied (hopefully!) by a nice step function profile on the GUI of the Instrument Manager, and usually activated to aid in dislodging any clogs. However, exactly what is happening when a Sneeze is activated on an instrument hardware function level remains a mystery to most users. More importantly, what the Sneeze tells us remains a point of confusion for most users. This technical note explains what the Sneeze is and clarifies what information it can give us and what it does not tell us.
The Sneeze cycle in the Archimedes software is a key pneumatics / fluidics routine. A pre-requisite for being able to use the Sneeze cycle in this way is that the reference fluid used on the instrument must have a different density to the fluid loaded on the sample side of the instrument. The recommended reference fluid solution is an aqueous dilution of deuterated water, diluted at a ratio of 15 parts H2O to 1 part D2O, which is expected to give a suitable density difference compared to regularly used ‘sample side’ fluids (such as water, PBS). Also, users should ensure that sample and reference vials are at least ¾ full.
Activating the Sneeze function causes the flow to repeatedly reverse direction in the bypass and sensor channel entrance. This allows reversals in the fluid flow across the sensor cantilever. During a Sneeze, a small amount of the reference fluid is forced into the cantilever and back out again for 2 cycles. This results in a frequency shift of the resonant frequency from baseline prior to Sneeze, to a downward shift of the resonant frequency as the reference fluid fills up the cantilever, and then back to baseline as fluid from the sample channel reenters the cantilever. Here we see a nearly “ideal” Sneeze profile. The profile in Figure 1 is long and rectangular, with fairly sharp edges where it reaches a maximum and then goes back to baseline. It can be described as a step function profile.
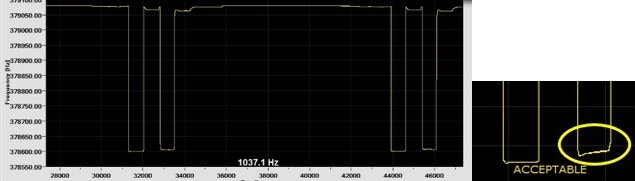
Figure 1: Example of a good Sneeze profile
As the Sneeze action causes the flow to repeatedly reverse direction in the bypass and sensor channel entrance, this function helps to remove remnant particles from the fluidics, and to free debris at the sensor channel entrance. If there are any partial blockages anywhere in the fluid pathways or air pathways, partial air leaks, or component issues, then the Sneeze cycle will trend away from that seen in figure 1. As such, the Sneeze fluidics action can be used both as a diagnostic tool to evaluate system health in terms of blockages, and also to aid in clearing blockages if present.
A variety of factors affect the shape of the Sneeze profile, such as the relative heights of the sample/sample waste/ reference/reference waste vials, how full or empty these vials are and the position of the sipper tubes within the vials. When the instrument pneumatics are working correctly without ANY air leaks in the system, AND unrestricted flow of the fluids through fluid lines and the sensor exists, AND all vials are perfectly positioned, AND waste vials are empty, AND sample and reference vials are at least ¾ full, then near ‘square waveform’ transitions in the sensor resonant frequency trace are expected, as in figure 1. However, what happens when one of these variables is in a different state?
What happens when the sample and reference vials are ¾ full, sample waste vial is empty, but the reference waste vial is full? This condition is one of the most common scenarios, since we tend to forget about checking the reference vial. Its physical location tends to put it in the category of “Out of sight, out of mind!”, and under normal usage, the instrument uses much smaller quantities of reference solution (and hence reference waste) than the sample (and sample waste). So, the reference waste vial fills up at a much slower rate and we tend to not check on it frequently. If the sample and reference vials are at ¾ full but the reference waste vial is also full and we perform a Sneeze, the result will be a Sneeze profile with one peak (figure 2). Emptying the reference vial will subsequently restore the sneeze profile to the ideal step function profile.
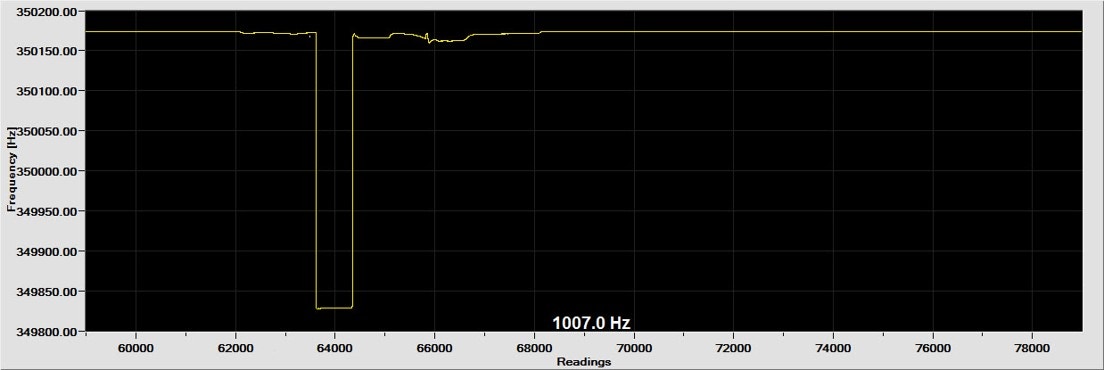
Figure 2: Sneeze profile obtained due to sample waste vial being empty but reference waste vial being full
The second most common scenario occurs when the sample waste vial is approaching full (sample and reference vials ¾ full and reference waste vial empty).
In this case, the Sneeze profile still has two square wave step function peaks, but we also see additional small peaks in between as is shown in figure 3.
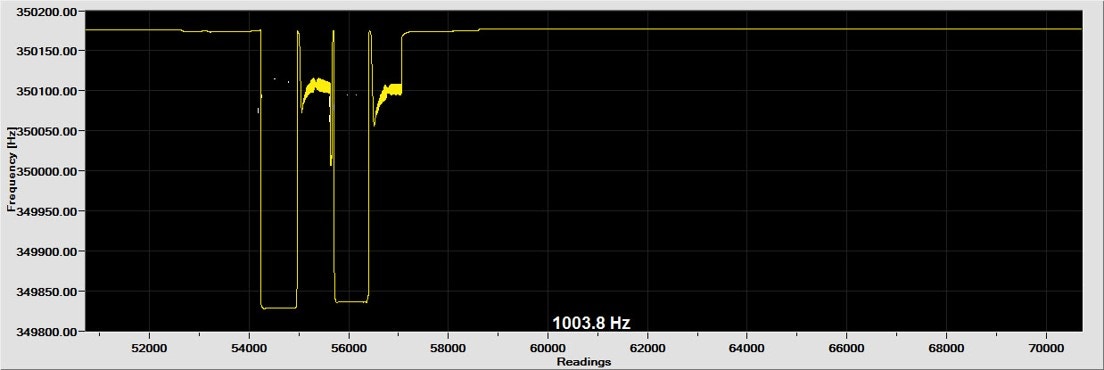
Figure 3: Sneeze profile when sample vial is full
Although less common, sometimes it happens that both the sample waste and the reference waste vials are full (with sample and reference vials ¾ full).
Figure 4 shows the Sneeze profile that results in this case: one peak and a small second peak.
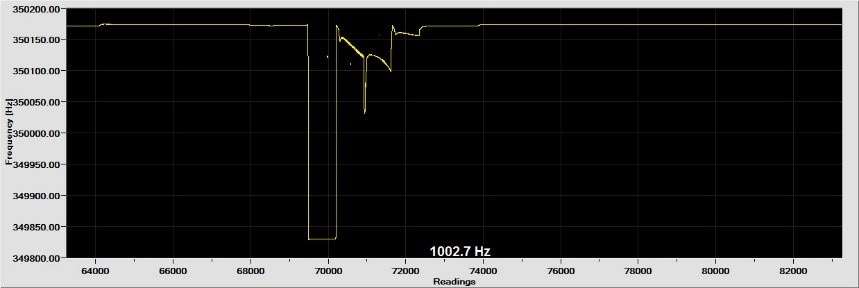
Figure 4: Sneeze profile when both the reference and waste vials are full
What happens to the Sneeze profile as the reference fluid volume changes?
Figure 5 demonstrates how the sneeze profile is affected throughout the course of a day as the reference fluid is depleted with heavy instrument usage. On refilling the vial, the ideal step function profile is restored.
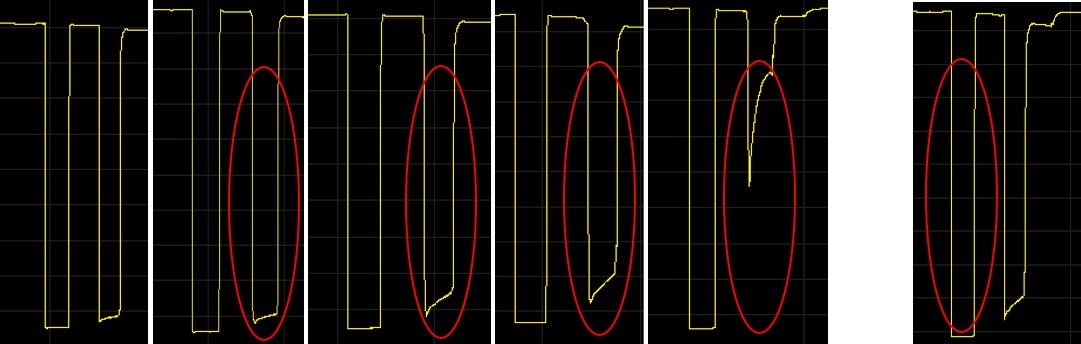
Figure 5: Sneeze profiles over the course of the day as the reference fluid volume decreases. Each sneeze is for a new sensor with empty waste vials. Far-right image: Reference Vial refilled showing the sensor is not blocked.
Finally, how is the Sneeze profile affected when a clog is present? Although the effect in the sneeze profile can vary depending on the clog type, figure 6 shows the typical sneeze profile seen when there is a clog in the bypass channel or cantilever, resulting in changes in the resonant frequency of the sensor as the density, and therefore mass, of the fluid flowing across the sensor changes from sample side fluid to reference fluid and back.
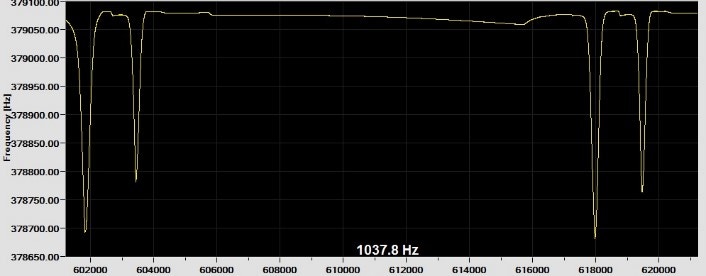
Figure 6: Example of a poor Microsensor Sneeze profile indicating partial blockages and/or air leaks. Note that the Sneeze profiles can vary considerably from this if blockages or air leaks are present.
The ideal Sneeze profile is characterized by two nice step functions on the GUI of the Instrument Manager. This occurs when: