
The Zetasizer Advance range is the new family of versatile light scattering instruments for measuring the particle size, zeta potential and molecular weight of dispersed nanomaterials via Dynamic, Electrophoretic and Static Light Scattering (DLS, ELS and SLS, respectively). This new range of instruments has been developed with the market-leading Zetasizer Nano range as its foundation. While there are many similarities between the Zetasizer Nano and Zetasizer Advance systems, this document aims to help you understand the differences and ensure that you are confident in transferring methods between instruments in the two ranges.
The following topics will be covered:
Both the Zetasizer Nano and Zetasizer Advance ranges use a highly coherent HeNe laser to illuminate a sample. Scattering from the sample is detected by single mode fibers arranged at specific angles. The laser power and scattering angles available depend on the specific instrument model in each family, but the illumination and optics can be considered comparable where there is an equivalence. Equivalent instrument configurations are shown in Table 1.
| Zetasizer Nano model | Zetasizer Advance model | Description |
|---|---|---|
Zetasizer Nano S90/ZS90
| Zetasizer Lab Blue label
|
|
Zetasizer Nano ZS 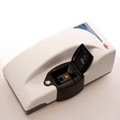
| Zetasizer Pro Blue label
|
|
Zetasizer Nano ZSP
| Zetasizer Pro Red label
|
|
Whilst the Zetasizer Lab and the Zetasizer Nano S90 both have detection optics at a traditional side scattering angle, the optics here are subtly different. The side scatter optics of the Zetasizer Lab and Zetasizer Ultra are focused, meaning that a smaller and better-defined detection volume is probed by the instrument. As a consequence, the Zetasizer Lab and Zetasizer Ultra side scattering optics are more sensitive than those on the Zetasizer Nano S90, and higher count rates will be measured for an equivalent sample; for example, a scattering standard such as toluene (see Table 2).
For this reason, if the count rate is used to infer differences in sample concentration, care should be taken when comparing count rates measured using different systems. A consequence of this is discussed in Section 5.
| Typical scattering intensity from Toluene | ||
|---|---|---|
| Zetasizer Nano S90/ZS90 | Zetasizer Lab (Blue label) | Zetasizer Lab (Red label) |
| >4 kcps | 15 kcps | 50 kcps |
The Zetasizer Pro and Zetasizer Ultra instruments have several additional optical features that can be used during a size measurement using backscatter, one of which is a switchable fluorescence filter. This filter allows fluorescent light emitted by sample particles to be blocked from reaching the detector, without reducing sensitivity when the filter is not needed. Additionally, optical polarizers can be moved into the back scatter optical path to enable Depolarized Dynamic Light Scattering measurements. Data from such measurements may be used to infer shape-related information about your particles [2]. The polarizers may also be used to improve signal quality, in some cases.
The sample-centric workflow of the ZS Xplorer software will show you which methods and measurements are available for different cells and cuvettes used with Zetasizer Advance instruments.
Standard 10 mm x 10 mm cuvettes (e.g. part numbers DTS0012, PCS8501, PCS1115) can be used for particle size measurements with any Zetasizer system and at any scattering angle.
Due to the high sensitivity, focused optical configuration of the side scatter optics, a cell having two transparent faces is not sufficient for a cell to be compatible with side scatter measurements. The optical path in and out of the cell needs to be comparable, so cells in which the sample volume is rectangular in cross section are not suitable for side scatter measurements. An example of a cell incompatible with side scatter measurements using the Zetasizer Advance systems is the ZEN0040 low volume disposable cuvette.
However, the new side scatter optics in the Zetasizer Advance range do enable use of a new cell, the Low Volume Disposable Sizing Cell (Figure 1), which brings several advantages. This cell (part number ZSU1002) comprises a 1 mm x 1 mm square capillary with high optical quality, which allows very small volumes (~3 µL) of the sample to be measured. The disposable capillary is contained in a custom holder to ensure alignment and good thermal contact. This small cross-section of the capillary also allows larger particle sizes to be measured more accurately than otherwise possible [3], but it does mean that the cell can only be used for side scatter measurements.
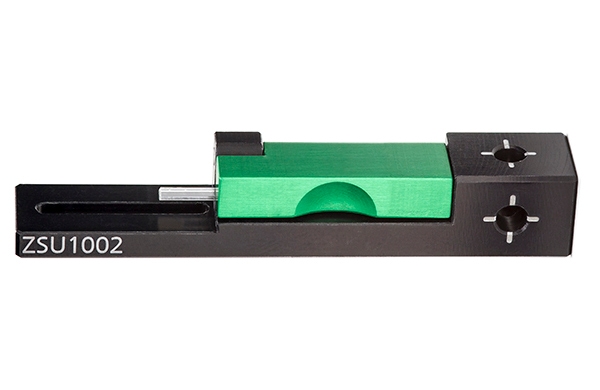
Figure 1: The Low Volume Disposable Sizing Cell, allowing measurements of 3 µL of sample and providing increased measurement integrity at larger particle sizes
The processing of light scattering intensity to generate particle size results requires a number of analysis steps. Table 3 below lays out these steps and describes the notable differences in the process for the Zetasizer Nano and Zetasizer Advance instruments.
| Process | Description | Differences between Zetasizer Nano and Zetasizer Advance | What this means for your data |
|---|---|---|---|
| Autocorrelation | The process of analyzing the fluctuations in scattering light to produce a correlogram. | The shortest lag time for the Zetasizer Advance correlator is shorter than that for the Zetasizer Nano. | Better sensitivity for small particles (~<10 nm). |
| Classification | How acquisitions or runs during a measurement are handled to reduce the impact of dust or contamination on the measurement. | The dust rejection algorithm of the Zetasizer Nano discarded data with the highest count rate. The Zetasizer Advance’s algorithm, Adaptive Correlation, only classifies data which is determined to be statistically different from the rest of the measured data. | Well- prepared samples will give comparable data, with measurements on the Zetasizer Advance systems taking less time. Where trace amounts of spurious material are present, repeat measurements will have better consistency. Where spurious material is consistently detected, this will be included in the final result [5-7]. |
| Cumulant analysis | Analysis method used to calculate Z Average and Polydispersity index | This analysis is unchanged in the Zetasizer Advance series of instruments | Any relevant discrepancy in ZAve or PdI will be caused by a sample effect and not by a change in the analysis. |
| Distribution analysis | Analysis method used to calculate particle size distributions. | The General Purpose and Multiple Narrow Modes analysis models in Zetasizer Advance series ZS Xplorer software are implemented exactly as in the Zetasizer Nano software. Protein analysis has been renamed ‘L-curve’, but retains the same implementation. CONTIN and discrete exponentials are not offered as options in the Zetasizer Advance series ZS Xplorer software. | Any relevant discrepancy in PSD will be caused by a sample effect and not by a change in the analysis. |
Guidance on creating measurement methods or SOPs in the ZS Xplorer software can be found in the Zetasizer Advance Basic Guide and User Manual [8].
Any SOPs created or saved from the DTS software for Zetasizer Nano cannot be opened in the ZS Xplorer software directly, but Table 4 describes any changes in equivalent settings or options in the new software to help create comparable methods.
| SOP setting (Zetasizer Nano Software) | Equivalent setting ZSXplorer |
|---|---|
| Sample Name | Name |
| Custom parameters | Parameters option |
| Material | Material |
| Dispersant | Dispersant |
| General options | |
| Mark-Houwink parameters | Not currently available in the ZSXplorer software. |
| Sample viscosity options | Dispersant viscosity is automatically used as sample viscosity. Viscosity can be edited using the Dispersant editing option found in the Dispersants dropdown. |
| Temperature | Temperature |
| Equilibration time | Equilibration time |
| Cell Type | Cell |
| Measurement | |
| Instructions | This option can be found by clicking on the ‘Other’ category on the side tab. The timing of an instruction can be changed to before or after the measurement by dragging and dropping to either above or below the measurement as required. |
| Advanced settings | |
| Correlators | No longer available to change in measurement set up. |
| Measurement duration | Adaptive correlation automatically chooses the optimum sub-run length and number of runs for the sample. If a fixed number and duration of sub-runs are required, the measurement process should be changed from automatic to manual. A set of discrete sub-run length options are available. |
| Positioning method | Positioning method dropdown provides the option to manually choose the measurement position. |
| Automatic attenuation | Attenuation dropdown has provides the option to manually choose the attenuator. Attenuation coefficients are comparable between the Zetasizer Nano and Zetasizer Advance. |
| Data processing – Analysis model | |
| General purpose | General purpose |
| Multiple narrow modes | Multiple narrow modes |
| Protein Analysis | L-Curve analysis |
| Not available | General purpose extended |
| CONTIN (research mode only) | No longer available |
| Discrete exponentials (research mode only) | No longer available |
| Reports | Can be managed in the ‘Report’ tab found at the top of the page |
| Export | Can be carried out from the ‘Analysis’ page |
| Start measurement | ‘Play’ button |
If transferring methods between instruments that use a different optical configuration, should we expect to receive comparable results? The answer to this is: “it depends”. Where there is a sensitivity difference, the range of concentrations that can be measured with comparable confidence will be different; however, where suitable data quality is achieved, comparable particle size parameters should be achieved if the only variable is sensitivity.
We are more likely to see a difference in reported particle size when comparing results captured via a different detection angle. According to Mie theory, particles over a certain size (~60 nm when discussing laser measurements) will scatter light non-isotropically, depending on their size. This means that differently-sized particles will be detected with different sensitivities at different scattering angles.
This does not mean that we will always see a difference in size, and all Zetasizer systems can be verified using monodispersed particle size standards, such as latex. Given their monodispersed nature, latices give comparable results in agreement with certified size ranges, whether measured using a backscatter configuration or side scatter configuration (Figure 2). Similar comparisons may be drawn with other small and/or monodispersed samples such as non-aggregated proteins.
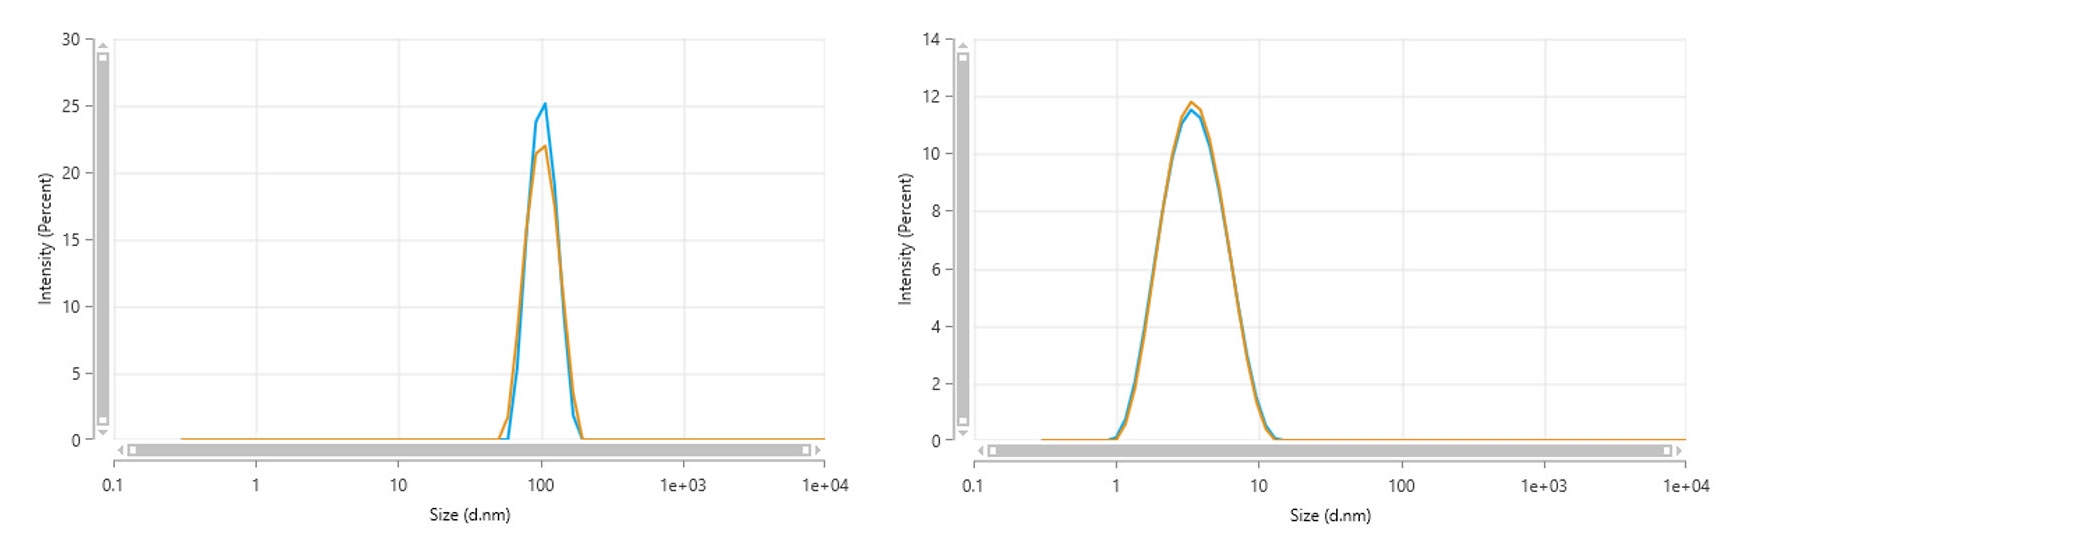
Figure 2: Intensity-weighted particle size distributions for a NIST-traceable 100 nm polystyrene latex sample, dispersed in 10 mM NaCl, and a 5 mg/mL dispersion of lysozyme in an acetate buffer. In both sets of data, the distributions measured using a backscatter optical configuration (blue) give exceptional agreement with the distribution measured using a side scatter optical configuration (yellow)
Differences in particle size measured using different systems may appear when the sample contains a broad distribution of sizes or is multimodal. For example, a mixture of latices of known sizes produces single broad size distributions with a different mode value when measured using backscatter or side scatter (Figure 3). Where polydisperse samples are being measured with methods being transferred across different optical configurations, a wider repeatability study to determine the range of sample-related variability may need to be performed.
If results are being compared to data delivered using different optical configurations, the Zetasizer Ultra variants offer both side scatter and backscatter options within the same instrument, for convenient data comparisons. Furthermore, a Multi-Angle dynamic light scattering (MADLS®) measurement may be performed using the Zetasizer Ultra, where the angular dependence of the detected scattering is used to derive an angular-independent result [2,9].
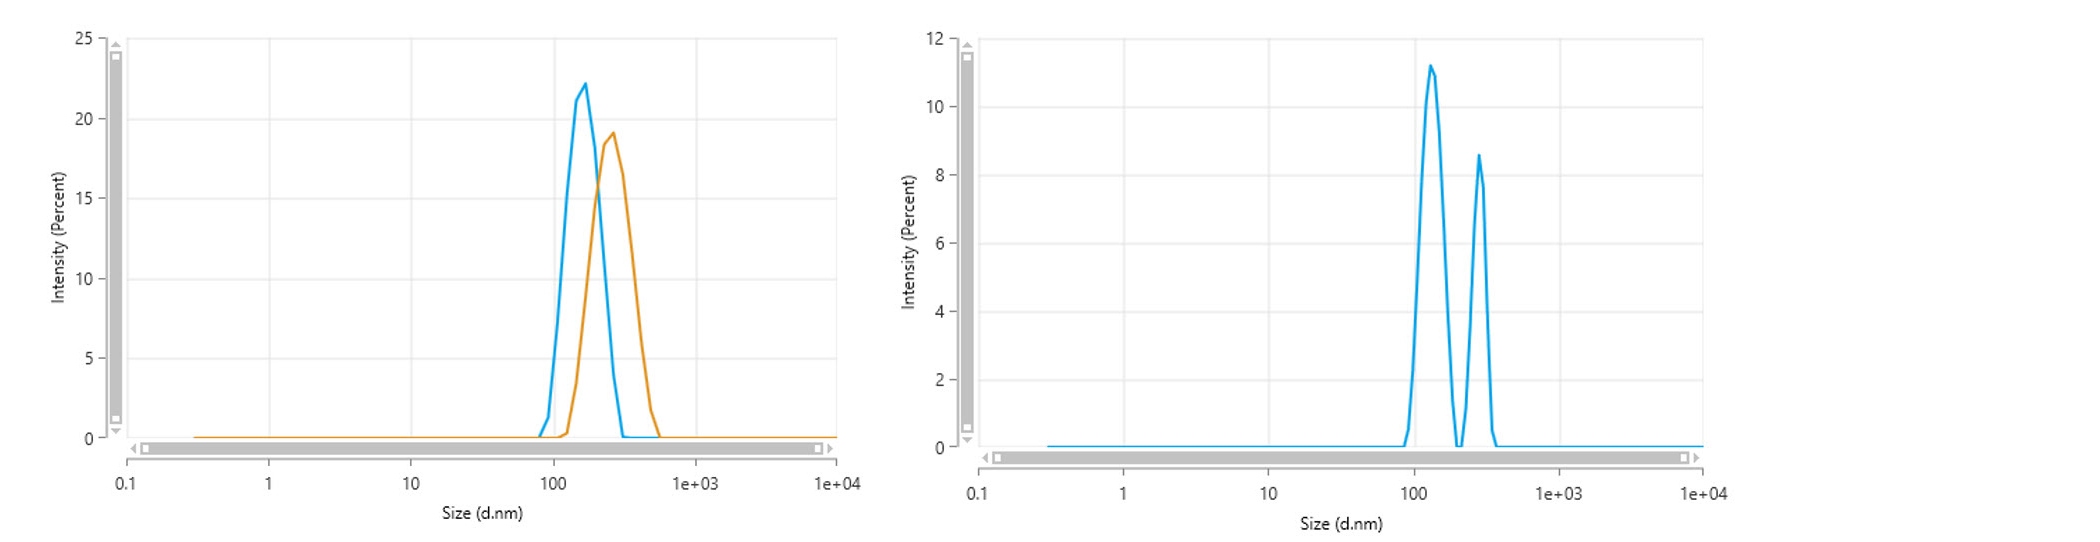
Figure 3: Left – Intensity-weighted particle size distribution for a mixture of 150 nm and 300 nm NIST-traceable polystyrene latex particles dispersed in 10 mM NaCl. The distributions for the backscatter measurement (blue) differ to those measured using side scatter (yellow), due to the differences in sensitivity to each particle size within the mixture as a function of detection angle. Right - Note that such a mixture can be resolved with an angular-independent measurement when the data from multiple scattering angles are combined via a MADLS analysis
Due to the increased sensitivity of the Zetasizer Lab compared with the Zetasizer Nano S90, any defined sample dilution protocols that are based upon measured count rate may need to be refined.
As discussed earlier, the Zetasizer Lab system will detect approximately 3-4 times more scattered light from the same sample than the Zetasizer Nano S90 system, so any inference about concentration based on scattering intensity cannot be directly translated. If we dilute a sample to give a count rate within a defined range, the resultant concentration will therefore be lower on the Zetasizer Lab than if measured and prepared using the Zetasizer Nano S90. As the Zetasizer Lab also has a focused optic, at very low concentrations we may also observe number fluctuations during our measurement. This occurs when the concentration is so low that the instrument becomes sensitive to individual particles transiting the laser beam.
As an example of this, a pigment sample was prepared using a previously-defined protocol, where the sample should be diluted until it gives a count rate of 150-400 kcps when using attenuator 9 or 10. This method was defined at a central development lab and then used as part of a Quality Control protocol implemented at various sites around the world.
If we follow this procedure independently using a Zetasizer Nano S90 and a Zetasizer Lab instrument, we see a larger size reported by the Zetasizer Lab, due to the lower sample concentration and the onset of number fluctuations. For a comparable concentration to be delivered by both instruments, we should expect a higher count rate for the Zetasizer Lab. As each instrument will optimize the count rate, we should therefore adjust the attenuator we define in measuring the count rate during sample preparation.
By refining the preparation such that the target count rate is achieved on attenuator 7 or 8, consistent distribution and Z-average sizes can be recorded on both the Zetasizer Nano S90 and the Zetasizer Lab (Figure 4).
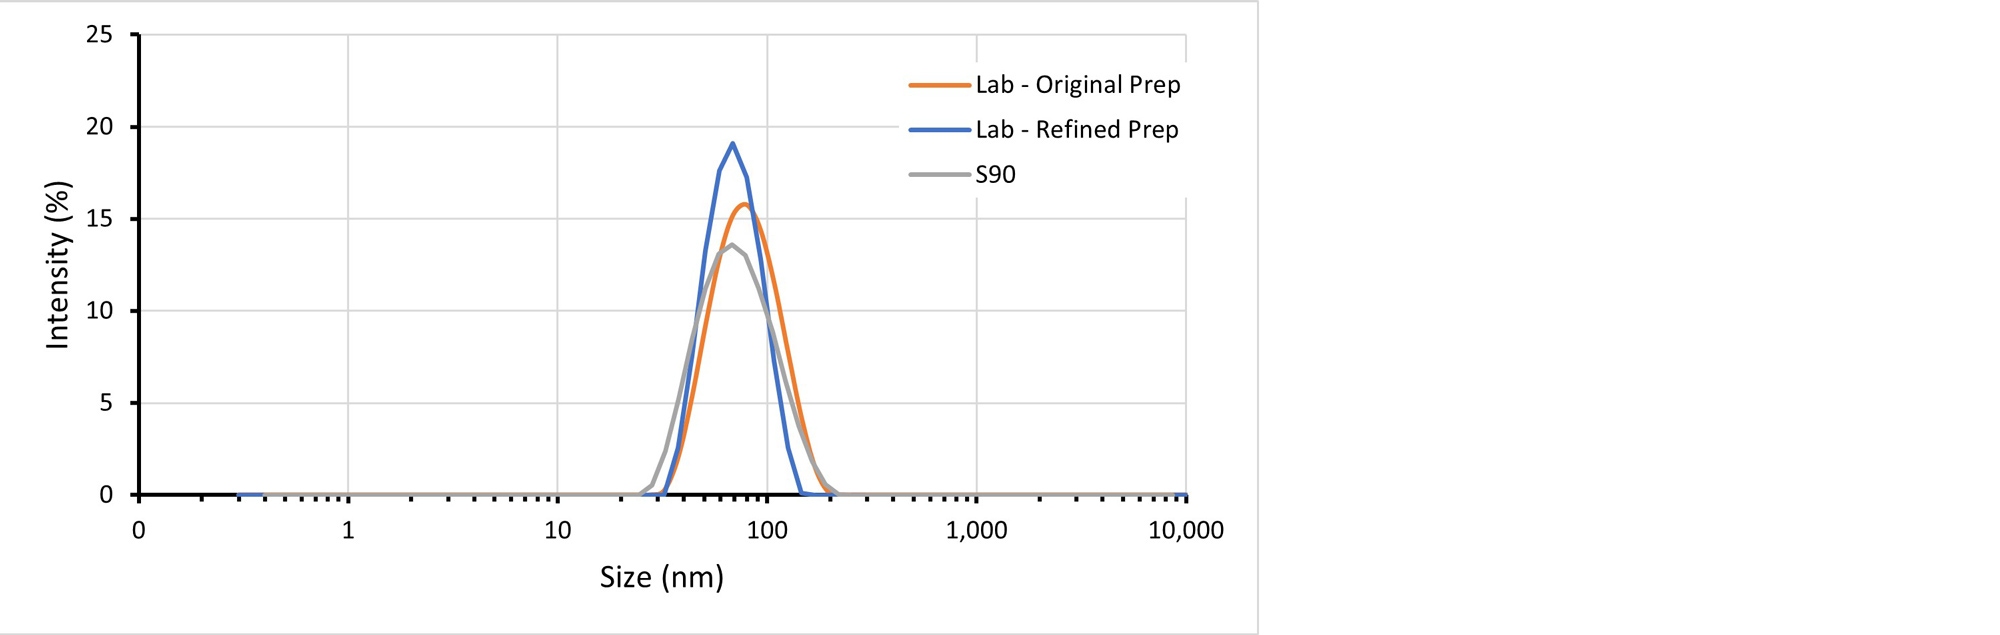
Figure 4: Intensity-weighted particle size distributions for a stabilized pigment sample dispersed in water. Separate aliquots prepared to give a comparable count rate using the Zetasizer Nano S90 and the Zetasizer Lab give results with an offset in the mode particle size. An aliquot prepared and measured using the Zetasizer Lab instrument, with consideration given to the difference in sensitivity, delivers a result with a mode size that agrees more closely with the Zetasizer Nano S90 instrument, but also with higher precision
In addition to the systems mentioned in Table 1, the Zetasizer Advance family also includes the Zetasizer Ultra variant, which has both classical side scatter capabilities and NIBS, so will complement an environment where both configurations have previously been used. For example, where method development may have been performed using a Zetasizer Nano ZS, and QA/QC measurements using a Zetasizer Nano S90.
Each optical configuration: Zetasizer Lab, Zetasizer Pro and Zetasizer Ultra is also available with a choice of two laser powers, providing a range of options for complementary or upgrade systems if looking to transfer method development for a particularly challenging application.
Table 5 below describes some potential benefits of considering alternative instrument configurations.
| Zetasizer Nano Instrument | Complimentary/ Potential Upgrade Zetasizer Advanced Instruments | Description |
|---|---|---|
| Zetasizer Nano S90/ZS90 | Zetasizer Lab Red label | Higher sensitivity enabled via a higher power laser, compatible with sample applications including biopharmaceutical and environmental sample applications. |
| Zetasizer Ultra Blue label | Equivalent laser power. Combination of NIBS and side scatter in the same instrument would complement applications where both the Zetasizer Nano S90 and Zetasizer Nano ZS are used. Also enables MADLS for an angular-independent result (samples < 500 nm diameter). | |
| Zetasizer Nano ZS | Zetasizer Pro Red label | Higher sensitivity enabled via a higher power laser, compatible with sample applications including biopharmaceutical and environmental. |
| Zetasizer Ultra Blue label | Equivalent laser power. Combination of NIBS and side scatter in the same instrument would complement applications where both the Zetasizer Nano S90 and Zetasizer Nano ZS are used. Enables use of low volume disposable sizing cell for low sample volumes and extended upper particle size. Also enables MADLS for an angular-independent result. | |
| Zetasizer Nano ZSP | Zetasizer Ultra Red label | Equivalent laser power. Enables use of low volume disposable sizing cell for low sample volumes and extended upper particle size. Also enables MADLS for an angular- independent result and particle concentration measurement. |
While there are some differences between both the hardware and software of the Zetasizer Nano range and the Zetasizer Advance range, both instrument families are built upon the same fundamentals, allowing methods and data to be readily compared across different systems. Some of the considerations in recreating existing methods, preparing samples and interpreting data have been discussed in this document.
[1] - Explaining the difference between Non-Invasive BackScatter (NIBS) and Backscatter – they are NOT the same. https://www.malvernpanalytical.com/en/learn/knowledge-center/technical-notes/AN151119NIBSvsBackscatter
[2] - Measuring the size of gold nanoparticles using multi-angle dynamic light scattering (MADLS). https://www.malvernpanalytical.com/en/learn/knowledge-center/application-notes/AN180516GoldNanoparticlesZetasizerUltra
[3] - V.Ruseva, M.Lyons, J.Powell, J.Austin, A.Malm & J.Corbet, Capillary dynamic light scattering: Continuous hydrodynamic particle size from the nano to the micro-scale, Colloids Surf. A, 558 (2018), pp. 504-511
[4] - Pushing the limits of DLS: Measuring large particles on the Zetasizer Ultra with the Low-Volume Sizing Cell. https://www.malvernpanalytical.com/en/learn/knowledge-center/application-notes/AN180516LargeParticlesZetasizerUltra
[5] - A.V. Malm, J.C.W. Corbett, Improved Dynamic Light Scattering using an adaptive and statistically driven time resolved treatment of correlation data. Sci Rep 9, 13519 (2019).
[6] - Adaptive Correlation: Better insight to the presence of aggregates. https://www.malvernpanalytical.com/en/learn/knowledge-center/application-notes/AN180518AdaptiveCorrelationAggregateInsight
[7] - Adaptive Correlation: Better DLS data with less time and effort. https://www.malvernpanalytical.com/en/learn/knowledge-center/application-notes/AN180430IntroAdaptiveCorrelation
[8] – Zetasizer Advance Series Basic Guide, https://www.malvernpanalytical.com/en/learn/knowledge-center/user-manuals/MAN0593EN
[9] – J. Austin, C. Minelli, D. Hamilton et al. Nanoparticle number concentration measurements by multi-angle dynamic light scattering. J Nanopart Res 22, 108 (2020).
![[i_180124_662_ZSU_r_6k_lan-1_Red_lab_FRKL Zetasizer lab top view.jpg] i_180124_662_ZSU_r_6k_lan-1_Red_lab_FRKL Zetasizer lab top view.jpg](https://dam.malvernpanalytical.com/dbce0397-62f8-4ce4-8528-afcb00b2132a/i_180124_662_ZSU_r_6k_lan-1_Red_lab_FRKL%20Zetasizer%20lab%20top%20view_Original%20file.jpg)
![[i_180124_688_ZSU_r_6k_lan-1_FRKL Zetasizer pro top view.png] i_180124_688_ZSU_r_6k_lan-1_FRKL Zetasizer pro top view.png](https://dam.malvernpanalytical.com/40fcbfdd-d122-4a86-ae22-b3fd00b2783f/i_180124_688_ZSU_r_6k_lan-1_FRKL%20Zetasizer%20pro%20top%20view_Original%20file.png)
![[red_ultra_FRKL - Zetasizer ultra top view.jpg] red_ultra_FRKL - Zetasizer ultra top view.jpg](https://dam.malvernpanalytical.com/b4b0767a-cea4-4250-82a8-afcb00b21ffc/red_ultra_FRKL%20-%20Zetasizer%20ultra%20top%20view_Original%20file.jpg)