Dissecting a ligand into smaller fragments can provide a strategy for analyzing the role of key functional groups in a protein-ligand interaction. Conversely, low-affinity ligand fragments that are able to occupy a receptor-binding site simultaneously, can often be linked together to form high-affinity inhibitors. The key challenge to such studies lies in measuring the thermodynamics of low-affinity interactions. This white paper will address the issues of studying low-affinity systems by Isothermal Titration Calorimetry (ITC). Topics will include working with receptor concentrations below KD (i.e., low c-values), and how displacement techniques can be employed to measure very low affinities while still complying with the c-value rule. Illustrative examples will be drawn from studies with carbohydrate-binding proteins.
Molecular recognition is a fundamental prerequisite to all biological processes from enzymatic catalysis to signal transduction. The modern pharmaceutical industry is built upon the concept of selective intervention in such systems (1). Furthermore, similar concepts are being implemented, through supramolecular chemistry, to develop novel smart materials, components for nanotechnology and molecular electronics (2). If we are to harness the full potential of molecular recognition, it is essential that we understand the subtle interplay between structure and thermodynamics in complex formation.
ITC has rapidly become one of the most common techniques for studying molecular recognition processes, and the technique of choice for determining the enthalpic and entropic contributions to the overall free energy of binding, ∆G° (3–5).
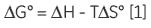
As ITC only requires that there is a measurable enthalpy change upon complexation, it is generally applicable to most systems. The thermodynamic parameters obtained from an ITC experiment describe the sum of all processes occurring in solution — formation and breaking of hydrogen bonds, conformational changes, desolvation, etc. Therefore, a single experiment will not allow determination of the contribution of an individual hydroxyl group or phenyl ring to the overall binding enthalpy or free energy. Dissecting the binding contributions of individual fragments of a ligand is possible by studying the interactions of a given receptor for a series of ligands that display systematic variations in their structures. Assuming that all of the fragment ligands bind in an analogous fashion to their parent ligand, then it is possible to apportion thermodynamic contributions to each part of the key ligand (Fig 1A).
However, if a particular functional group or fragment is a major contributor to the total binding energy, then removal of that fragment will leave a ligand with very poor affinity for the receptor. Although one might conclude, qualitatively, that the deleted group is essential for activity, to achieve a more informative, quantitative picture of the system, it is necessary that even the lowest affinity interactions are measured.
|
|
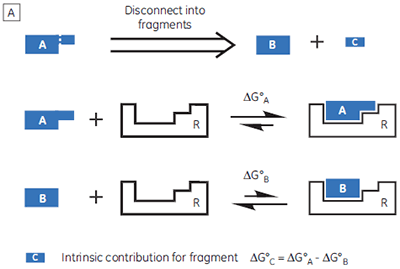
If a high-affinity ligand can be broken down into low-affinity fragments, then the converse must also be true: if two or more, low-affinity fragments can be accommodated simultaneously in a receptor binding site, it should be possible to connect them together, via a suitable linker, to form a high-affinity ligand (Fig 1B). In fact, this phenomenon is already widely known as the chelate effect (6). Once one half of a bivalent ligand has bound to its receptor, there is a very high local concentration of the second recognition element in the vicinity of the binding site, thus increasing the probability of the second interaction taking place. Alternatively, the chelate effect can be described in terms of the entropic penalty that must be paid for loss of independent rotational and translational degrees of freedom when two molecules interact to form a single particle (7). When two fragments of a bivalent ligand bind to their receptor, the penalty must be paid twice. However, the full bivalent ligand need pay this penalty only once, and thus may interact with a substantially improved affinity.
This fragment-based strategy for ligand design is gaining wider acceptance in the pharmaceutical industry (8,9), in particular in situations where high-throughput screening of existing compound libraries has failed to identify a suitable lead compound for a given target protein. Typically, NMR-based screening methods are employed to identify pairs of small molecule “fragments” (< 250 Da), and to provide structural data on their orientations in the receptor binding site (10,11). ITC can provide complementary information, for example, confirmation of fragment binding. Furthermore, selecting fragments that display the most favorable enthalpy changes may prove a useful strategy for maximizing binding selectivity for the final ligands (3). However, using ITC to determine the thermodynamic parameters for low-affinity systems is not always trivial. Two strategies for studying weakly binding ligands will be outlined in this white paper, but first it is important to understand the specific problems associated with low-affinity systems.
|
|
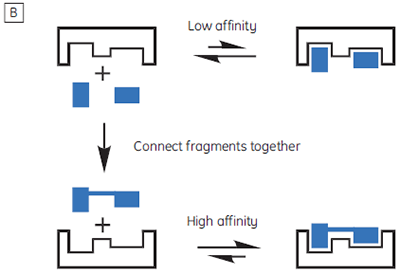
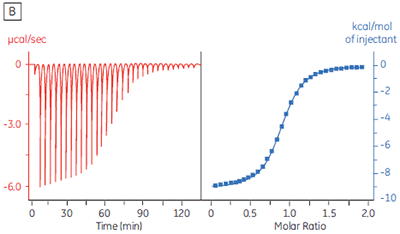
The isothermal titration calorimeter comprises two cells — a sample cell in which the titration experiment is performed, and a reference cell which contains only water (Fig 2A). The constant temperature of each cell is maintained by a small heater controlled by a power feedback system. During the titration of an exothermic system, heat is released when the ligand and receptor interact. If both cells are to remain at the same temperature, then less power must be supplied to the heater controlling the temperature of the sample cell, than to the heater for the reference cell. The difference in power that is supplied to each cell is recorded as a function of time (Fig 2B). Integration of this power vs time curve gives the heat change associated with each consecutive addition of ligand to the receptor solution in the sample cell.
At the beginning of the titration, relatively large amounts of heat are released on each addition of ligand, reflecting the substantial increases in complex formation at each step. By the end of the titration, all receptor binding sites are now occupied, and subsequent heat changes are mostly the consequence of diluting the ligand into the sample cell. The enthalpy change, ∆H°, binding constant, K, and number of binding sites, n, can all be determined by nonlinear least squares curve-fitting using a suitable model (12,13), for example for simple 1:1 binding:
|
where [X]t and [M]t are the total ligand and receptor (macromolecule) concentrations, respectively, V0 is the effective volume of the calorimeter cell, and dQ is the stepwise heat change for each point during the titration. ∆G° and ∆S° may then be calculated using Equation 1 and Equation 3:
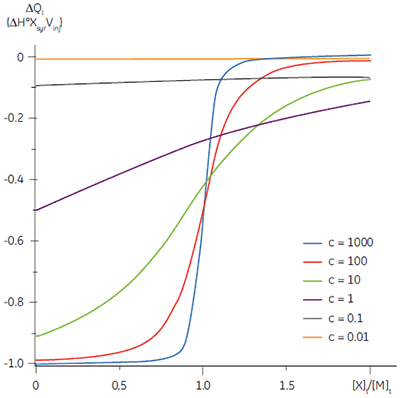
Whereas ∆H° influences the intercept on the y-axis, and the stoichiometry, n, controls the position of the inflection point, the overall shape of the curve depends on both the binding constant, K, and also the concentration of binding sites, n[M]t. This relationship between affinity and experimental design is summarized by the so-called Wiseman c-parameter:
The shape of the curve, including the position of the y-intercept relative to ∆H° irrespective of the absolute scaling along the x- and y-axes, is dependent on the value of c as shown in Figure 3 (12). For c-values greater than 10, the curve is clearly sigmoidal, and tends toward a vertical step as c approaches affinity. However, as c decreases below 10, the inflection point becomes poorly defined and the binding stoichiometry can no longer be determined experimentally. Therefore 1 < c < 500 is necessary to allow simultaneous determination of ∆H°, K, and n. The limits of the c-value experimental window provide a particular problem for studying low-affinity interactions.
|
For a system with KD = 1 mM, a c-value of 10 would require the initial receptor concentration to be 10 mM, and the final ligand concentration to be approximately twice this value. As the sample cell typically has a volume of approx. 1.4 ml, each experiment would therefore require a substantial amount of the binding partners. However, many proteins of moderate size are not soluble above 1 mM, and the ligand concentration in the syringe usually needs to be 10 times the receptor concentration in the sample cell. Therefore, receptor and ligand solubility are actually the principal limitations for studying low-affinity systems using traditional approaches to ITC experimental design.
If ITC is to prove useful in such cases, it would be necessary to design the experiments in such a way that the amount of ligand and receptor required to complete the titration is minimized. Conducting the titrations either in the presence of competing ligands, or under low c-value conditions, provides two such strategies.
The first situation to consider is a thermodynamic structure-activity relationship study of a moderate to high-affinity ligand (KD> in the µM-nM range). Here, the objective of the study is to determine what contribution each part of the molecule makes to the overall free energy, or enthalpy of interaction with a receptor. High-affinity ligand A can be disconnected into two fragments — B and C (Fig 1A) for subsequent binding studies. Although the high-affinity ligand (A) binds sufficiently tightly making it easy to achieve a sigmoidal curve, fragments B and C each have KD > 1 mM — the solubility limit for receptor, R.
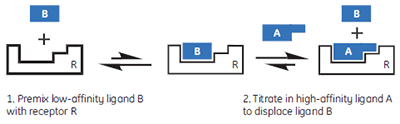
|
In this hypothetical example, there is one “well behaved” ligand that can be studied in the usual c-value experimental window, while the other two ligands should be weak competitive inhibitors of the A-R interaction. Therefore, it should be possible to study the weak ligands through competition/displacement assays (Fig 4). If the high-affinity ligand A is added to a solution of the receptor and low-affinity fragment B, the receptor will still preferentially interact with ligand A. However, the shape of the binding isotherm will be perturbed relative to that obtained in the absence of B. If a fraction of the receptor molecules are currently bound to fragment B, then the concentration of the free receptor which is available to interact with A is reduced, and the binding isotherm will have a more shallow curve, reflecting a lower apparent c-value. Similarly, if both ligands A and B bind with negative enthalpy changes, then displacement of fragment B from the binding site will be an endothermic process, that must occur prior to the exothermic binding of A. Therefore, the apparent ∆H° value for A binding to R will be less negative.
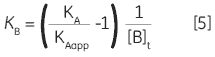
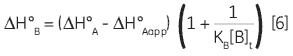
Zhang and Zhang introduced a method for deriving low-affinity binding parameters from displacement titrations that have been subjected to curve fitting using the standard one site model (14). The binding constant and binding enthalpy for the low-affinity ligand (B) are calculated using Equations 5 and 6:
|
|
where KA and KB are the binding constants for the high and low-affinity ligands, respectively. KAapp is the apparent (i.e., experimentally measured) binding constant for ligand A in the presence of a given concentration of ligand B ([B]t). The ∆H° parameters are defined in an analogous fashion.
This approach has now been largely superseded by Sigurskjold’s rigorous displacement model (15), which allows the binding parameters to be determined directly during the curve-fitting process. Although Sigkurskjold originally introduced the model for extending the high-affinity limit of the c-value experimental window, this method is equally applicable to low-affinity systems, and has been used to study fragments of EDTA-binding metal ions (16), and carbohydrate derivatives binding to lectins (17,18).
As long as K and ∆H° are known for the high-affinity ligand, A, the corresponding parameters can be determined for the low-affinity fragment, B. Displacement assays thus offer the opportunity to measure low-affinity interactions in the normal c-value experimental window, while using lower concentrations of the receptor (i.e., c-values are defined with respect to the high-affinity interaction). In our experience, concentrations of the low-affinity ligand that are comparable to its KD for the receptor, are adequate for successful application of the displacement strategy. These concentrations are much lower than would be necessary for a direct titration under low c-value conditions (see below).
Of course, three important caveats must be noted: 1) error in the parameters for the high-affinity ligand will become incorporated in the parameters derived for the low-affinity competitor; 2) for a comparative dissection of free energy changes, one must assume that the low-affinity fragment is binding to the same part of the receptor as the corresponding portion of the high-affinity ligand; 3) this strategy is only suitable for measuring low affinities when a suitable high-affinity ligand is available. Therefore, the competition approach is suitable for structure-activity relationships, but not for fragment-based drug design, where the objective is to find a high-affinity ligand. However, in this latter case, low c-value titrations may be appropriate.
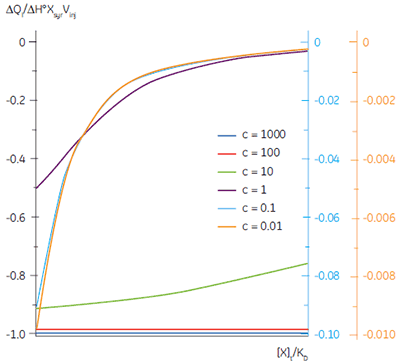
It is always preferable to conduct ITC experiments under conditions that lead to a sigmoidal shape of curve. However, for low-affinity systems for which no high-affinity competing ligand is available, or where the receptor concentration is limited by either solubility or availability, then there is no alternative to low c-value titrations. Figure 3 shows that as c decreases below one, the curve becomes a flat featureless line, and thus not suitable for curve fitting. However, this traditional depiction of the Wiseman isotherm is somewhat misleading. The inflection in the curve does indeed become poorly defined as c decreases, but the curve is not flat!
|
In crossing the c = 1 boundary where KD = [M]t, the system has moved to a new regime, under which receptor occupancy is essentially independent of receptor concentration, and principally dependent on the ratio of ligand concentration [X]t to KD. If Figure 3 is redrawn with [X]t/KD on the x-axis as shown in Figure 5 (19), then it is now the high c-value curves that appear flat, whereas the low c-value curves approach a constant hyperbolic shape, albeit with different scaling on the y-axis. Figure 5 demonstrates that for c < 1, a ligand concentration five times higher than KD is required to approach receptor saturation.
Over 100 equivalents of ligand would be required to achieve 90% saturation at c = 0.1 — a long way from the standard two equivalents that are added during a titration conducted at c = 10. Although, at first glance, the low c titration appears to be more wasteful in terms of ligand consumed, one must remember that these are relative quantities. In absolute terms, the low c titration requires 1% of the receptor concentration and about 50% of the ligand concentration used at c = 10. It is important to note that for low c values, there is no simple correlation between [X]t/[M]t and receptor saturation; adding only two equivalents of ligand per binding site will achieve very little complexation and an inadequate portion of the binding isotherm to allow successful curve fitting. So how much of the binding isotherm is required? In our experience, very similar results are obtained for titrations concluding with 70, 80 or 90% receptor saturation (19).
As c decreases below 10, the inflection in the curve becomes ill defined, and the more simple shape of curve that results is inadequate to justify three variable parameters in the fitting equations. Therefore, it is necessary to fix the binding stoichiometry when curve fitting. This observation has an important practical consequence for experimental design: when a titration is conducted with c > 10, it is essential that much less than one equivalent of ligand is added in each injection, so that an adequate number of data points can be acquired to define the shape of the binding isotherm. If a similar approach was adopted for a low c titration, with the final [X]t/[M]t ~ 50, then up to 500 small injections could be necessary, each resulting in a very small increase in receptor binding, and probably very poor levels of signal-to-noise. However, if stoichiometry is not to be determined experimentally, then there is no need to record many data points around the equivalence point of the titration curve. Therefore, it is more appropriate to divide the titration into the usual 20 to 30 injections, and add several equivalents of ligand each time, thus maximizing the signal-to-noise ratio for each data point.
It is worth noting that achieving adequate levels of signal-to-noise is usually less of a problem for low-affinity systems, as the magnitude of the heat change for each injection depends on the amount of complex formed, and the molar enthalpy change, ∆H°. For a given value of c, the system with the lower affinity will, by definition, have more receptor present. If both high- and low-affinity systems reach an equal level of receptor saturation, following an equal number of injections, then it is the low-affinity system that will display the highest level of signal-to-noise.
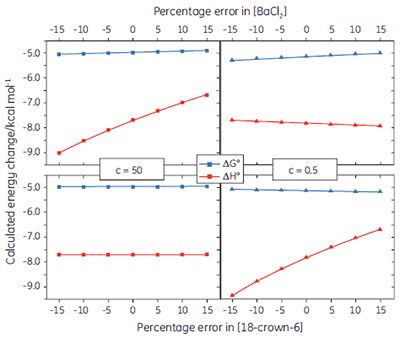
If binding stoichiometry is fixed during curve fitting, it becomes very important that the concentrations of the ligand and receptor are known accurately, as there is no longer an independent check on these values during the curve fitting process. Figure 6 shows how errors imposed on the receptor or ligand concentration influence the calculated values for ∆G° and ∆H°, under both high and low c value conditions. In general, concentration errors have little effect on ∆G° - probably as a consequence of the logarithmic relationship between ∆G° and K (Eq 3). However, the accuracy of ∆G° is more highly dependent on the accuracy of the receptor concentration (for low c values), or the ligand concentration (for high c values).
|
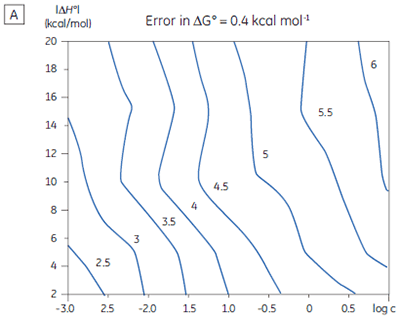
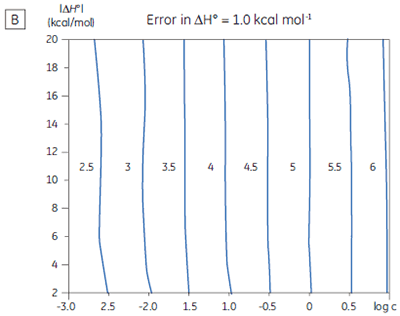
If a few simple rules are followed — achieving an adequate portion of the binding isotherm with good levels of signal-to-noise, and accurate knowledge of receptor concentration — it is quite possible to obtain binding data for low-affinity systems at low c-values. Guidelines for assessing the accuracy of titrations conducted below c = 1 have recently been proposed by Turnbull and Daranas (19), and are summarized in Figure 7. For ∆G° or ∆H° to have an error less than 0.4 kcal mol-1, or 1 kcal mol-1, respectively, a particular combination of ∆H° and log c must lie to the right of the appropriate log KA line. For example, a system with KD = 1 mM (log KA = 3), and ∆H° = -10 kcal mol-1, studied at c = 0.01 (log c = -2), should give ∆G° with an error less than 0.4 kcal mol-1.
However, the same system studied at c = 0.001 (log c = -3), would give a result outside the designated error limit. These figures are derived from simulated data sets based on the technical specifications of MicroCal™ VP-ITC (19). Although they give a reasonable estimate of accuracy from the perspective of signal-to-noise as a function of ∆H° and c-value, they do not allow for error in ligand or receptor concentrations. As such they provide only a rough retrospective check on the validity of experimentally derived parameters.
|
|
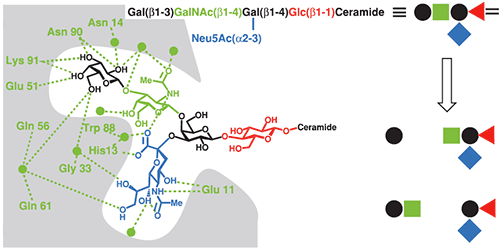
Protein-carbohydrate interactions mediate many important biological processes, including cell adhesion and signal transduction (20). However, they typically have low affinities in the millimolar to micromolar range at best. A notable exception to this rule is the high-affinity interaction between the cell surface glycolipid, ganglioside GM1 and the B-subunit of the cholera toxin (CTB) (21). Cholera toxin is an AB5 protein complex — a single A-subunit, which possesses a cytotoxic ADP-ribosyl transferase activity, and five identical copies of the B-subunit which acts as a receptor for the oligosaccharide portion of GM1. Adhesion of the toxin to cell surface GM1 is a prerequisite for toxin endocytosis and activation.
The CTB-GM1 interaction is a common benchmark for binding assays, and has consequently been studied using a wide range of techniques including fluorescence spectroscopy (22), surface plasmon resonance (23), atomic force microscopy (24) and ITC (17,25). CTB and its complexes with GM1 oligosaccharide (GM1os), and analogous oligosaccharides, have also been studied extensively by X-ray crystallography (26). The crystal structure reveals that the branched GM1os binds to the protein in a “two fingered grip” (Fig 8), with extensive hydrogen bonding to the three sugar residues at its nonreducing terminus. The remaining two sugar residues point away from the protein surface, and form the point of attachment to the ceramide lipid, which anchors GM1 in the cell membrane.
|
The GM1os pentasaccharide was dissected into fragments from mono- to tetrasaccharides to assess the contributions made by each of the three terminal sugar residues to the overall binding energy (17). It is important to use soluble oligosaccharides (i.e., lipid free) in such studies, to avoid multivalent interactions that would complicate data analysis and interpretation of the results. Also, where appropriate, the sugar residue at the reducing terminus of the oligosaccharide fragment was fixed as the methyl glycoside with the appropriate anomeric configuration. It was most convenient to measure the concentrations of the oligosaccharides by NMR spectroscopy, using a known concentration of ethanol as an internal standard, followed by freeze drying and dissolution in an appropriate volume of buffer. Protein concentrations were determined by UV absorbance at 280 nm.
|
|
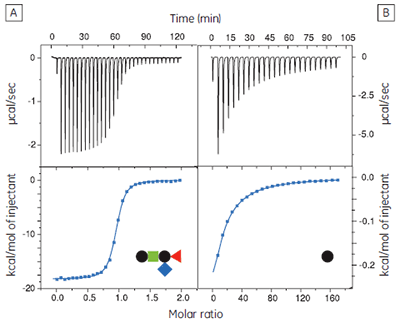
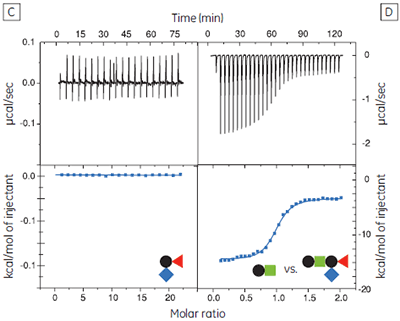
The GM1os oligosaccharide was found to bind very tightly (KD = 43 nM), and gave a well-defined sigmoidal curve with an excellent level of signal-to-noise (Fig 9A), when using an initial CTB subunit concentration of 10 µM (c = 230). However, all other fragments bound very weakly, and even when using much higher concentrations of CTB (typically 145-265 µM), only low c value hyperbolic curves were obtained (Fig 9B). No binding could be detected in the case of the sialyl lactose trisaccharide (Fig 9C), despite adding more than 20 equivalents of ligand (final ligand concentration = 5 mM — higher concentrations were prohibited by availability of the ligand). A flat binding profile could result from either a very small enthalpy change, or a dissociation constant that is much higher than the maximum ligand concentration used. Subsequent studies were consistent with the latter argument.
Although good quality data could be obtained for some ligands at these low c values (c = 0.03 for Fig 9B), the high concentrations of CTB necessitated recycling the protein by dialysis and freeze drying. Therefore, displacement assays were adopted as an alternative approach that proved to be more efficient, both in time and amount of protein used for each experiment. A typical displacement titration is shown in Figure 9D. This titration was identical to that shown in Figure 9A, except it was performed in the presence of 25 mM GalGalNAc disaccharide. The displacement experiment shows a significant reduction in the normalized enthalpy change and a more gentle slope around the equivalence point. The substantial increase in the heat of dilution, evident toward the end of the titration, is a consequence of having 25 mM ligand in the cell, but none in the syringe. For uncharged oligosaccharides, it is usually possible to approximate the heat of dilution to a constant value that can be subtracted from each data point. However, in the case of charged ligands or ligands with a high heat of dilution compared to heat of interaction, it is preferable to maintain equal concentrations of the low-affinity ligand in both the syringe and the cell, especially if the ligand concentration approaches that of the buffer. If the ligand is available in sufficient quantities, concentrations are most easily matched by dialysing the receptor against a solution of the low-affinity ligand. The Sigurskjold displacement model script can be modified easily to accommodate having the low-affinity “B” ligand at a constant concentration.
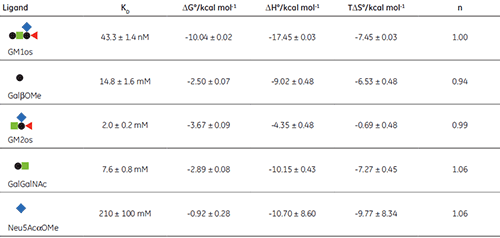
The displacement assay allowed parameters to be measured for all fragment ligands, including the very low-affinity methyl sialoside (red diamond). Errors quoted in Table 1 are those returned by the Origin™ curve fitting software. Duplicate titrations demonstrated that errors in KA from displacement titrations were approximately ± 20% - roughly three times the error of the direct GM1os-CTB titration. The larger uncertainty in the methyl sialoside parameters is not a consequence of its low affinity for CTB, per se, but rather because the ligand concentration used was less than KD for that interaction. In all other cases, the concentration of the low-affinity ligand was 1-3 × KD. Where measured, there was reasonable agreement between the thermodynamic parameters measured by low c titrations and the displacement method. For example, the low c titration of GalGalNAc and CTB (c = 0.01) gave KD = 8.3 mM, ∆H° = -9.3 kcal mol-1, T∆S° = -4.3 kcal mol-1.
The results in Table 1 show that ∆G° for GM1os is much greater than the sum of ∆G° for any two complementary fragment ligands that could be added together to form GM1os. This result is indicative of the efficient chelate effect in the bivalent GM1os ligand. Furthermore, comparison of ∆G° for GM1os and the GalGalNAc disaccharide, demonstrates that the sialic acid residue contributes almost half of the free energy change for the full ligand, despite its exceptionally low affinity for the receptor. A more complete discussion of these results has been published previously by Turnbull, et al. (17).
|
ITC is a useful technique for studying low-affinity interactions. Displacement titrations are well suited to studying systems where a high-affinity competitor ligand is available, and the low-affinity ligand is soluble to at least a concentration matching its KD for the receptor. Alternatively, direct titrations can be performed at low c values, outside the traditional experimental window, as long as care is taken in designing the experiment to record an adequate portion of the binding isotherm with good levels of signal-to-noise. In all cases, the validity of ∆H° values is dependent on accurate knowledge of the ligand and receptor concentrations.
This paper was authored by Dr. W. Bruce Turnbull, School of Chemistry and Astbury Centre for Structural Molecular Biology, University of Leeds. Work described was conducted in collaboration with Professor S. W. Homans and Dr A. H. Daranas, and was supported by a Wellcome Trust International Prize Travelling Research Fellowship awarded to W. Bruce Turnbull.