Drinking water in the US and developed nations of the world is treated to remove contamination of foreign materials, both mineral and organic. Contaminants can be present in almost any water source and can be observed in water supplies obtained from mountains, rivers and soil, with even greater contamination potentials coming from domestic sewage and industrial waste.
Cryptosporidium and giardia are examples of microscopic parasites prevalent in surface water. These parasites cause gastrointestinal diseases and have caused large outbreaks of illness. One example of this was a 1993 outbreak in Milwaukee, WI where 400,000 people became sick. Surface water is most vulnerable but poorly constructed and shallow wells are also at risk.
One of the requirements for removing or inactivating these types of parasites is to enhance the coagulation capabilities in water treatment facilities. Impurities in waste water are primarily anionic or negatively charged. Cationic (positively charged) additives have been developed to neutralize these charged anionic contaminants. By introducing optimal quantities of cationic additives that will cause this system to reach a neutral charge, it is possible to improve the efficiency of removing contaminants via sedimentation or filtration. Zeta potential measurements provide a tool that quantifies the optimal concentration of the oppositely charged additives required to enhance coagulation of contaminants from a water supply.
In addition, zeta potential measurements can be used to monitor the amount of coagulant needed to clarify water supplies. Zeta potential is a good index of the repulsive interaction between particles. Zero zeta potential means that the contaminants in the water are unstable, i.e. that the conditions for aggregation are maximized. Zeta potential provides a measurable quantity to identify maximum aggregation conditions.
Plots of zeta potential vs. coagulant dosage are used to evaluate the effectiveness of various chemicals (typical examples are alum, ferric sulfate, etc.) and a number of commercial brands of cationic polymers (these usually contain a quaternary ammonium surfactant that imparts the cationic surface charge). Zeta potential can also be used to adjust coagulant dosage levels periodically in order to minimize cost of chemicals for water purification. The Malvern Instruments Zetasizer Nano line of instrumentation can be used as a precise and accurate monitoring device for water clarification purposes.
All zeta potential measurement were carried out using a Zetasizer Nano instrument and an MPT-2 autotitrator by Malvern Instruments. The zeta potential measurements were carried out in reusable/disposable capillary cells.
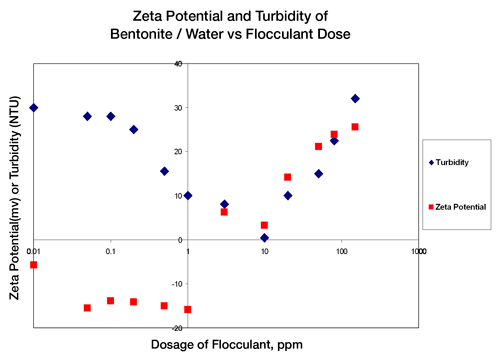
Firstly, a model experiment for contaminated water is considered. In the example below bentonite clay particles have been mixed into water. Bentonite is an aluminum-silicate clay material that when dispersed in water is negatively charged. Similarly, naturally occurring contaminants are also primarily negatively charged. Untreated water with bentonite clay is cloudy, i.e. has a turbid appearance.
Small particles in the water causing this turbid appearance do not settle rapidly. In the case of water treatment applications, charged particles should always be considered to be stable particles and are undesirable. Therefore, the objective is to reduce the surface charge of the water contaminants by treating the contaminating materials with oppositely charged additives to the point where the charge of the contaminating material is close to zero or neutral. Again, these oppositely charged additives (cationic additives in this case) will adsorb to the surface of the (anionic) clay particles. Under these conditions when the clay particle/additive complexes have little or no charge, there will then be no repulsive forces maintaining the stability of these particles in solution. Therefore, the contaminating material will aggregate into larger particles which then settle quickly under gravity.
By studying the concentration of flocculant additive dosage vs. zeta potential and turbidity, it can be seen that when the zeta potential of the water mixture results in a near zero zeta potential, the turbidity, or cloudiness, of the mixture is also nearly zero. Figure 1 indicates that at low dosages of flocculating agents the zeta potential is approximately -16mV and the turbidity is high. At the point where the zeta potential value becomes +2mV the turbidity is at an absolute minimum. After this point in charge and turbidity, further addition of flocculating agent now reverses and increases the charge of the contaminating material and therefore restabilizes these particles in the water. The results shown in Figure 1 verify that there is an optimal concentration (10ppm) for addition of flocculating materials and the measurement that is critical to the control of the additive concentration is zeta potential.
|
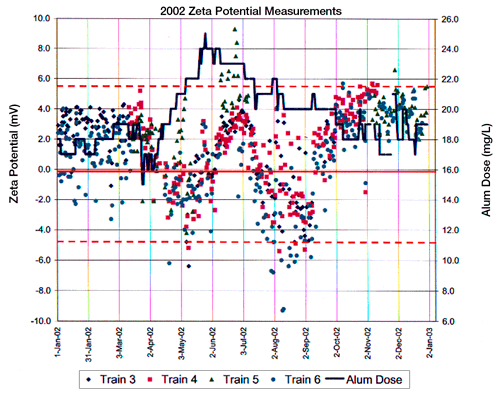
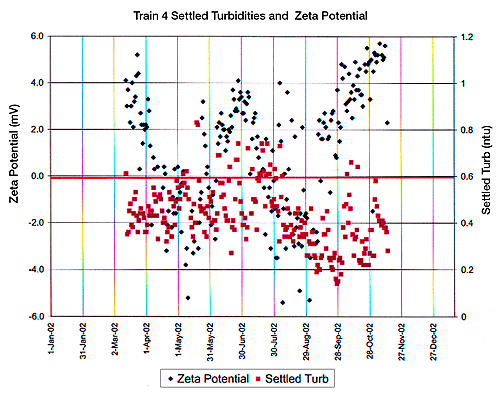
In the case of a full scale water treatment production facility, the concentration of the flocculating agent (alum in this case), the zeta potential and the turbidity would be monitored and adjusted during each work shift, each day. Figures 2 and 3 provide a view of water treatment facility’s control charts obtained over the one year period of 2002.
|
|
Figure 2 indicates zeta potential vs. alum concentration in four settling tanks across a US city’s water treatment facility. Figure 3 indicates zeta potential and settling turbidity of the water produced in one train or tank at this same manufacturing facility.
The goal of this US based manufacturing facility is to maintain a zeta potential around zero, specifically between the values of +5 and -5mV. Because of requirements for thorough mixing of the flocculating agent with the incoming water supply, Figure 2 indicates that there is a lag time between alum dosage and a shift in the zeta of the measured water samples. However, only by measuring and monitoring the zeta potential on control charts can the alum adjustment be made in a rational and optimal manner for the water production facility.
The zeta potential results are key to monitoring and maintaining optimal conditions in this water treatment facility. The zeta potential measurements are easy to make and operator independent. The operators at this water treatment facility had the following comments about zeta potential and its importance to water production:
1.) Amirtharajah, A., C.R. O’Melia, Water Quality & Treatment, A Handbook of Community Water Supplies; 4th Ed. Ch.6 Coagulation Processes, Destabilization, Mixing and Flocculation, F.W. Pontius, Ed. McGraw Hill, Inc. NY 1990, p269-365.
2.) Stumm, W. and J.J. Morgan, Aquatic Chemistry, 2nd ed., Wiley Interscience, 1981.
3.) Schroeder, E.E., Water and Waste Treatment, McGraw Hill, 1977.