
Polyvinyl chloride (PVC) is a common polymer used in countless applications from pipes, to flooring, and electrical insulation. As one of the world’s most widely produced polymers, it is very much a commodity polymer where tight margins mean little room for detailed analysis. However, even in this case, high level analytical tools can be used to characterize the polymer for appropriate grading. For example, the glossiness of a PVC sample has a significant effect on its finish and grade, and for which applications it can be used. Applying appropriate characterization tools can help grade different PVC batches, assigning them to appropriate applications to maximize the value of high quality batches, saving lower grades for others.
In this application note, four PVC samples of known differences in glossiness were measured with both multi-detector GPC and rotational rheometry. The results both explain the differences in glossiness and the likely cause of those differences.
Polyvinyl chloride (PVC) is a common polymer used in countless applications from pipes, to flooring, and electrical insulation. As one of the world’s most widely produced polymers, it is very much a commodity polymer where tight margins mean little room for detailed analysis. However, even in this case, high level analytical tools can be used to characterize the polymer for appropriate grading. For example, the glossiness of a PVC sample has a significant effect on its finish and grade, and for which applications it can be used. Applying appropriate characterization tools can help grade different PVC batches, assigning them to appropriate applications to maximize the value of high quality batches, saving lower grades for others.
Gel-permeation chromatography (GPC) and rotational rheology are two common and highly complementary tools used in polymer characterization.
GPC is primarily used to measure the molecular weight and molecular weight distribution of polymers. Historically, GPC generated a ‘relative’ molecular weight against calibration standards such as polystyrene, however light scattering detectors enable the measurement of absolute molecular weight. The addition of a viscometer further enables analysis of structural aspects such as branching and cross-linking to be performed. As a molecular characterization tool, GPC can be used to predict the properties of polymeric materials. It can therefore be used as a quality control tool to predict product performance prior to spending time and energy on manufacturing.
Rotational rheometry is a bulk characterization tool for measuring the viscoelastic properties of polymers and polymeric formulations. A benefit of rotational rheometry is that it can simulate ‘real-world’ situations to indicate how finished products and complex formulations might behave after manufacturing.
In this application note, four PVC samples of known differences in glossiness were measured with both multi-detector GPC and rotational rheometry. The results both explain the differences in glossiness and the likely cause of those differences.
Four samples of PVC of different glossiness were analyzed by GPC and rotational rheology.
Samples were dissolved overnight in THF and filtered through 0.2 µm nylon filters and then separated across two Malvern Panalytical T6000M columns and measured using the OMNISEC multi-detector GPC system including refractive index (RI), low-angle light scattering (LALS), and intrinsic viscosity (IV) detectors. Samples were injected in triplicate.
OMNISEC was calibrated using a NIST traceable polystyrene standard to determine detector offsets, band-broadening corrections and detector constants.
The samples were tested by oscillatory frequency sweep within the linear viscoelastic region. The tests used a 25 mm parallel setup with a 1 mm gap at temperatures of 160, 170, and 180 C. Samples were pre-molded into 1 mm discs using a Carver press and the samples were used directly in their melt state with no dissolution needed. Frequency sweeps ranged from 0.005 to 20 Hz and were performed witrh a Bohlin Gemini rheometer.
Figure 1 shows overlaid chromatograms for the four PVC samples in the RI, LALS, and IV detectors. The quality of the chromatography is excellent and there are clear differences are visible between the samples. While the samples elute mostly in a single peak in the RI detector, two peaks are clearly apparent in the LALS signal in two of the samples. The calculated molecular data for the four samples is shown in Table 1. Results are shown as mean and % relative standard deviation for the duplicate measurements.
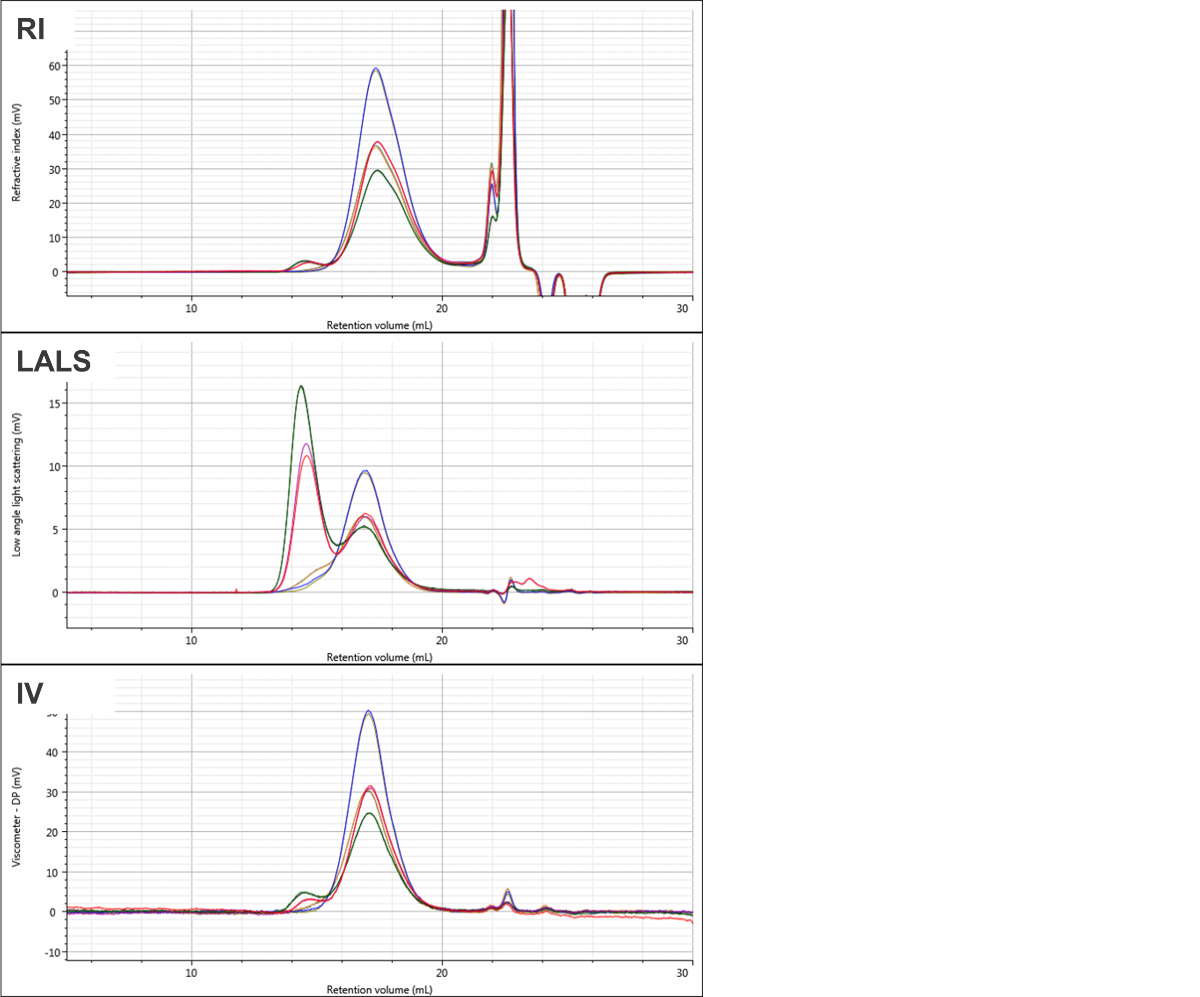
Figure 1: Overlaid chromatograms for duplicate injections of the four PVC samples showing RI (top), LALS (middle), and viscometer (bottom). The four samples are PVC1 (red & purple), PVC2 (green and black), PVC3 (blue & olive), and PVC4 (orange & grey).
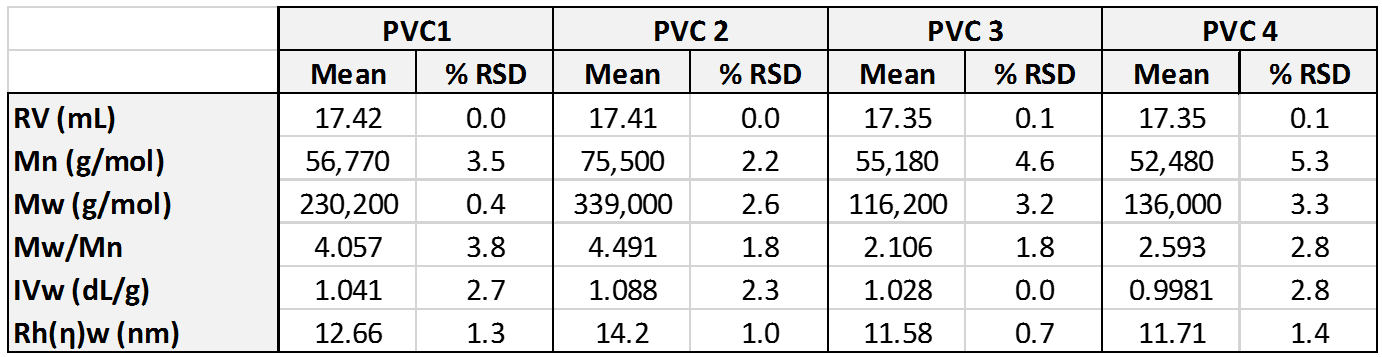
Table 1: Molecular parameters for the four PVC samples measured using OMNISEC.
The molecular weight results show clear differences between the samples despite the fact that their RI signals largely overlay, aside from some differences in concentration.
Figure 2 shows the low shear viscosity plots for the four PVC samples. The samples are ordered from top to bottom as PVC2, PVC1, PVC4, and PVC3, which directly correlates with their molecular weights. As expected, the molecular weight is strongly correlated with the low shear viscosity of the molten polymers.
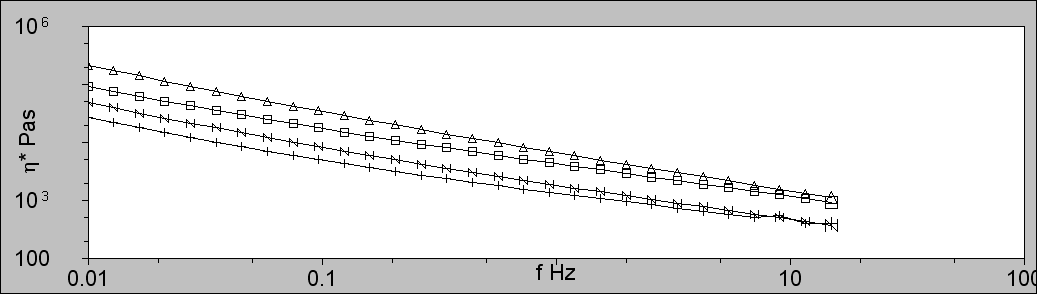
Figure 2: Low shear viscosity of the PVC melts using a Bohlin Gemini Rheometer showing PVC1 (squares; □), PVC2 (triangles; ∆), PVC3 (plus; +), and PVC4 (N). The low shear viscosity increases with Mw.
The molecular and bulk properties of polymers are often closely linked. For example, molecular weight is often correlated with polymer strength. In this case, we are interested in surface finish and in PVC, this is closely correlated with cross-linking at the molecular level. Therefore, the samples were studied more closely to try to understand their changes in glossiness.
Figure 3 shows overlaid Mark-Houwink plots for the four samples. The Mark-Houwink plot is an indicator of polymer structure and is often used to study changes in branching. However, structural changes in the form of cross-linking are also clearly visible on these plots. Here, it can be seen that at lower molecular weights, below approximately 250,000 Da, the plots for all of the lines overlay. Above this threshold, the lines diverge with the highest molecular weight samples showing the most deviation. This is particularly apparent for samples 1 and 2 and this is a strong indicator of cross-linking within these samples.
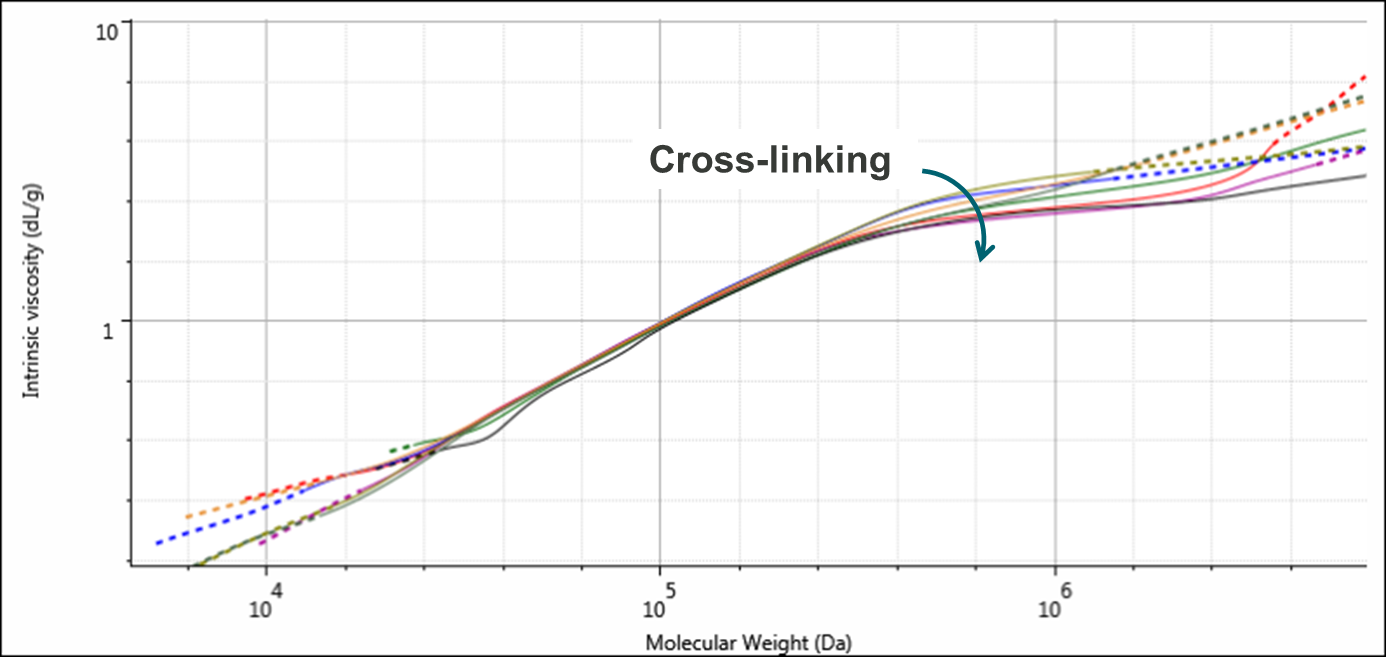
Figure 3: Overlaid Mark-Houwink plots for duplicate injections of the four PVC samples. The four samples are PVC1 (red & purple), PVC2 (green and black), PVC3 (blue & olive), and PVC4 (orange & grey). Cross-linking is increasing along with molecular weight.
The rheology data also indicates the presence of cross-linking for 2 of the samples. As part of the analysis, frequency sweeps were performed at 160, 170, and 180°C. As can be seen in figure 4, G’ is linear at 160 and 170°C, however, at 180°C, the plot plateaus at low frequencies indicating the formation of structure as a result of cross-linking.
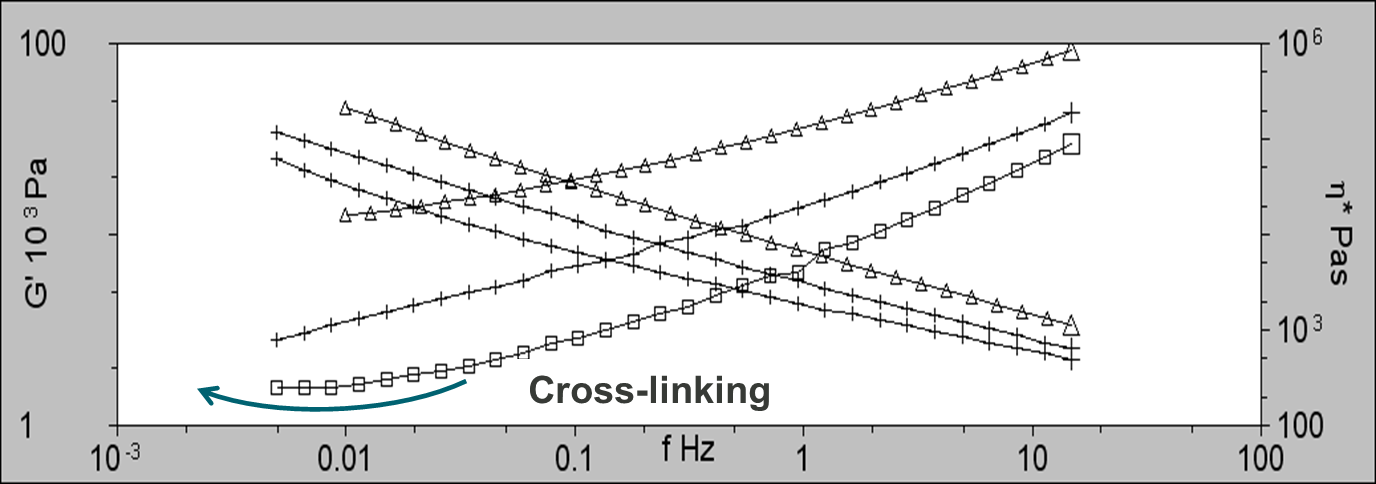
Figure 4: Frequency sweeps for PVC2 showing G’ at 160°C (triangles; ∆), 170°C (plus; +), and 180°C (squares; □). Plateauing in G’ is an indicator of cross-linking.
It is well documented in the literature that the rheological parameter that relates to the optical quality (haze & gloss) of extruded polymer melts is the elasticity of the melt. As can be seen at low frequencies, G’ increases with increasing degree of cross-linking. This is known as stick-slip. This is where the melt intermittently breaks away from the die wall causing surface roughness. The more elastic the melt, the rougher the surface of the extrudate because stick-slip is more pronounced.
Both of the techniques used in this application note have been able to identify the presence of cross-linking in some of the PVC samples. This correlated with their molecular weight and the presence of an additional peak in the GPC light scattering detector. The rheology data also indicates a likely cause of the cross-linking. The cross-linking was seen to increase when the measurements were performed at higher temperatures suggesting that a possible cause of the existing cross-linking in the samples was processing at too high temperatures during their manufacture. This wastes energy and reduces the glossiness, thereby increasing production costs and reducing product value by limiting the applications for which it can be used. The value of the PVC production is therefore doubly affected by the observed cross-linking.
While rheology is a powerful tool used to measure the final polymer product, multi-detector GPC could be used on the raw polymer prior to product formulation and manufacture to predict if that product would meet its release specifications. As can be seen here, using these analytical tools, even the value of commodity polymers such as PVC can be maintained or increased, by saving energy, and appropriately grading products to their final application.