Introduction
Dynamic Light Scattering (DLS) and Electrophoretic Light Scattering (ELS) are versatile techniques that are used to characterize the size and zeta potential of particulate materials. They are most commonly applied to colloidal systems, nanoparticles and macromolecules in solution or dispersion. Of course, the specifications of a DLS/ELS instrument are vital when comparing systems from different manufacturers. But if you don’t use your system in the right way, or don’t take advantage of all the options, then you won’t get the best out of it.
So here we cover not just the specifications you should be thinking about when purchasing an instrument, but other key aspects, such as sample type and workflow. That way, you’ll get a system that does exactly what it needs to do for you, and does it well.
DLS and ELS essentials
DLS uses the light scattering of particles or molecules undergoing Brownian motion to measure their diffusion coefficients. These are then converted into size distributions.
ELS uses the Doppler effect arising from the motion of light-scattering particles to measure their speed in the presence of an electric field. This is then converted into a zeta potential value (or distribution).
Because of the similarity of the technology involved in DLS and ELS, and the complementary nature of the results, most systems on the market (including our Zetasizer Advance range) offer both techniques.
1. Are you focusing on the most important application?
Are you working on a well-defined application in the industry sector? If so, then you might find this an unnecessary question.
But if you’re in academia, then things might be different.
It’s commonplace for grant holders to be asked to extend the required specification for an instrument, for the sake of a colleague elsewhere in the university with a different application focus.
If that’s the case for you, then now is the time to be firm about your requirements. The best value for money is obtained from a system that is optimized for your applications (and at Malvern Panalytical we offer several models to choose from).

Don’t compromise on your most important applications – ideally, you should aim for a system that’s tailored to your particular class of samples.
2. Are you confused about what the important specifications really are?
So, you know you need a DLS/ELS system. You compare what’s on offer from different manufacturers… and suddenly you’re overwhelmed by specifications. But which specifications are the most important to ensure good performance for samples commonly encountered in materials science?
Let’s keep things as simple as possible. The seven specifications that you should be looking at are:
- Measurement type: Because of the similarity of the technology involved in DLS and ELS, most systems on the market (including our Zetasizer Advance range) offer both techniques. Having both gives you a wider picture of particle behavior and ensures you’re ready for future challenges in your lab. In addition, even if you’re just interested in ELS measurements, it’s wise to take a DLS measurement before and after, to check that the application of the voltage hasn’t affected the size characteristics of your sample. Finally, our ‘Ultra Red’ model provides particle concentration measurements too (and it’s almost as good as a dedicated small-angle X-ray scattering or single-particle ICP-MS system).
- Measurement angles: This metric frequently causes confusion because of the way that many manufacturers talk about it. For many years, the standard measurement angle was 90°, which has the benefit of only needing a simple optical design, and is still popular with analysts who prefer to use long-standing methods (or who have limited budget). However, you can improve on this basic capability by using backscatter measurements (usually 170–175°). This increases the measurement volume eight-fold, compared to a 90° measurement (improving sensitivity for low concentrations), and brings the focal point back towards the cell wall (eliminating the need to dilute a turbid sample to avoid the confounding effect of multiple scattering).
- Multiple angles: Related to the above point is the ability to measure at multiple angles, and the considerable improvement in size resolution that you can get as a result. For example, the MADLS® method used on our Zetasizer Ultra models measures at three angles, but then combines the raw data in such a way as to generate a single, angleindependent result with a higher signal-to-noise ratio and greater precision than that obtained at any single angle.
- Sample volume: In many materials applications, the sample is not in short supply, and you’ll be able to use
the regular cuvette volumes (usually >1 mL). But if your sample quantities might be restricted, you’ll need to check the lowest sample volume you can use and still get good results (Zetasizer can handle down to 3 μL for size measurements, or 20 μL for zeta potential). - Particle size range: The particle sizes that can be measured by DLS vary enormously – from nanoparticles with sizes below 1 nm to colloidal suspensions of particles up to 10 μm across. Values for ELS are slightly different. But look beyond the maximum and minimum sizes possible with the instrument: what really matters is the size range you need, and whether the instrument is optimized for it. Only in that range will you get the most reproducible results.
- Concentration range: In materials applications, concentration limits and ranges are very sampledependent, although there is usually a greater need to measure higher concentrations, such as for inks and pigments. It’s therefore good to know that Zetasizer Advance systems can handle everything from a 0.1 mg/mL solution of latex, up to 40 wt% solid suspensions.
- Laser power: This is the odd one out in this list, as although slightly higher powers are useful for lower-concentration samples, in general laser power is not a good guide to performance. Our systems use either 4 mW or 10 mW lasers, which combined with efficient optical design and other sensitivity-enhancing features such as NIBS (see ‘Samples with very low or very high concentrations’ in Section 3), give excellent results for even the most challenging samples. However, some manufacturers, in an effort to match such performance, have boosted laser power to 40 mW or even 100 mW. But this comes with the risk of sample heating and more noise, and the resulting changes in viscosity can seriously compromise your results. So focus on performance, not power.
So to conclude this section, technical specifications are clearly an essential part of the decision-making process, and you can see more about what Zetasizer Advance range offers here. But remember that specifications need to be considered in conjunction with other features of the instrument, and the performance they provide for your particular samples.

From the laser through the sample to the detectors and into the correlator, a DLS measurement relies on the integrity of the hardware components and the sophistication of the algorithms in the analysis software.
3. Are you tired of having to check every time whether you can analyze a new sample type?
One frustration faced by customers when purchasing a DLS/ ELS system is that the success of the technique depends critically on the exact nature of the sample. This often makes it necessary to have a detailed discussion with a technical expert before you analyze anything slightly unusual. Although we’re always happy to talk through your application, we appreciate that you don’t want to be doing that every day of the week, so we’ve tried to make our Zetasizer systems as versatile as possible.
So when considering buying a DLS/ELS system, check whether it can handle the following types of samples:
- Non-spherical particles: Conventional DLS assumes that the particles are spherical, so if this isn’t the case, then standard data treatment would give you results that don’t reflect the true particle size. The solution is to make use of the fact that rotational diffusion of nonspherical particles causes depolarization of the scattered light. In the ‘Depolarized DLS’ technique we’ve devised, the degree of vertical and horizontal polarization is
compared with what would be expected from a spherical particle, allowing conclusions to be drawn about the particle’s likely deviation from sphericity. This enables allowances to be made during data-processing. - Fluorescent particles: Fluorescence interferes with DLS measurements because the light is not correlatable, which causes more ‘noise’ in the data. On Zetasizer instruments, if you know that your sample fluoresces (or the instrument detects that it is fluorescing), you can bring a narrowbandwidth filter into the optical path, which filters out the fluorescence and reduces its effects on data quality.
- Very large particles: The measurement of larger particles in standard sample cuvettes can be difficult because particle motion due to thermal convection obscures the Brownian motion that is responsible for scattering. The Low-Volume Disposable Capillary Cell makes it easier to measure particle size for larger particles (1–10 μm) by avoiding this thermal convection.
- Field-sensitive particles: Some particles (especially proteins, but potentially also certain polymers, organic framework materials and colloidal gels) can be degraded by the application of the electric field used for ELS. On our systems, this can be tested by using a ‘size–zeta–size’ protocol (which incidentally is one of the benefits of having DLS and ELS on the same instrument). But if you’re running electrically-sensitive samples regularly, it would be worth using one of our folded capillary cells, and loading the sample using our ‘diffusion barrier technique’. This introduces a small plug of sample (e.g. 20 μL), separated from the electrodes by the same buffer that the sample is dissolved in, which ensures that the sample is kept away from the electrodes (where most of the damage occurs).
Also note that when you’re comparing instruments, it’s the electric field strength (V/cm) that is the determining factor in degradation, not the voltage or current per se. - High-conductivity samples: Samples with high ionic strength (and hence high conductivity) can exhibit ion build-up on the electrodes during ELS measurements, causing a reduction in current. Real-time compensating circuits (such as our ‘Constant Current Zeta’ technology) keep the current unchanged, avoiding errors in the results. Zeta potentials for such samples can also be distorted by the net flow of charged particles, known as electro-osmosis, but this can be solved by making a measurement at high frequency (where electroosmosis does not occur), and complementing this with a low-frequency measurement to recover distribution information. This is known as a mixed-mode measurement (‘M3’) and is implemented in our M3-PALS method.
- Samples with very low or very high concentrations: Our Non-Invasive Back-Scatter (NIBS) technology increases dynamic range in two ways. Firstly, it allows the detection volume to be increased, for better resolution and sensitivity at low concentrations compared to 90° systems. Also, because it uses backscattered light, it keeps the scattering volume close to the front of the cuvette, meaning that the problem caused by multiple scattering from high-concentration samples is reduced.
- Opaque samples: For the same reason that NIBS is useful for high-concentration samples (see above), it can also help with opaque samples, as shown in this video.

The NIBS technology on the Zetasizer Advance automatically finds the optimum measuring position even in highly opaque samples. With data guidance in the ZS XPLORER, you can decide whether (blue trace) to work with as-received or dilute samples, and you can enjoy an informed choice whether to dilute and to what extent.
4. Are you concerned that your sample prep might be letting you down?
Problems in sample prep can arise simply because its importance is under-appreciated, but more often it’s simply because of the learning curve involved – it takes months or even years of experience to learn how to prepare samples to get the best results.
But if you can’t wait that long, you can make your life a lot easier by purchasing a system (like ours) that helps you avoid some of those everyday sample prep problems. Here are some things to consider:
- Single-use polystyrene cuvettes eliminate issues around cleaning, and mean that you don’t have to decant your sample to a new container if you want to keep it.
- Software protocols (our ‘Adaptive Correlation’ algorithm) can spot transient fluctuations in the data, allowing the effects of dust to be removed from the calculations (see “Does the analysis account for the effects of dust?” in Section 5). Software that identifies transients reduces the need to filter samples and dispersants before measurements.
- The ability of the instrument to handle highconcentration samples reduces the need for dilution and the errors that often arise from it.
- Our low-volume easy-load capillary cells employ clever snap-fastener methods, making it easier to handle much lower volumes of material.
In summary, it’s worth taking the time to fine-tune your sample prep procedures and to be aware of instrument features that will eliminate the chance of sample prep errors.
 (A) Our low-volume capillary cell holder allows measurements to be taken from samples as low as 3 μL. The patented snap-fastener reduces the risk of breaking the glass capillaries.
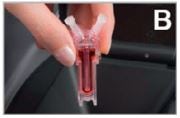 (B) Our completely disposable capillary cell for ELS measurements – ready for the diffusion barrier technique.
 (C) Our dip cell lets you measure zeta potential in both aqueous and non-aqueous dispersants.
 (D) Our easy-fill optical-quality cuvette is a classic for a large range of sample types.
5. Have you thought about the reliability of the data you’ll get?
The very nature of DLS and ELS means that the results are highly sensitive to variations in the sample, imperfections in the instrument, and fluctuations in environmental conditions. So it’s not enough simply to have a system that generates results – you need to have confidence in those results.
How can you achieve that? By having a BIG focus on the small points that contribute to data quality. Attention to all of these details helps you to separate the really good instruments from those that are simply adequate.
So, when you’re buying a DLS/ELS system for a materials application, ask yourself what’s on offer to boost confidence in results. You should find that this list of questions is a good starting point.
- Does the analysis account for the effects of dust? Even with the best sample prep, from time to time you’ll get aggregates, dust and other unwanted particles in your sample, which can skew your result by causing short-lived or ‘transient’ scattering events. Our ‘Adaptive Correlation’ method classifies DLS data as either steady-state or transient, and only the former is then used in the size calculations. (And just in case you’re wondering, we don’t discard any data – we just label sub-runs based on their statistical relevance, so everything is still there should you want to see it).
- Does the system accurately measure temperature, and also minimize the risk of temperature fluctuations? Any unexpected temperature fluctuation during the measurement means a change in viscosity, which results in a change in particle mobility, and hence an error in the result for size or zeta-potential. To overcome such worries, you need to be satisfied about the quality of the lasers in the instrument, the sensitivity of the detector, and the robustness of the optical components. For example, are all the key components fixed to a monolithic optical bench, and does the instrument ensure that the temperature is stable before measurements are taken
- What sort of cuvettes does the system accommodate? Cuvettes with the best optical quality give you the most reliable results. We offer a large range to cover all applications, as described in this blog post.
- How well can the system cope with multiple particle sizes? This depends on size resolution – the ability of the instrument to distinguish between particles of different sizes in the same sample. Fortunately, differences in the way light is scattered at different angles can provide additional information on particle size, and so, by taking measurements at multiple angles, you can improve your resolution. But be warned – instruments from some manufacturers simply give you all the results, and then leave you to work out which answer is best. In our MADLS method we do the maths for you, and provide you with a single result. The algorithm is complicated, but you can find out more here.
- Does the system take account of charge shielding in zeta-potential measurements? In solutions with high conductivity, ions can build up on the electrodes, ultimately causing a reduction in current. Our ‘Constant Current Zeta’ method uses a real-time compensating circuit to maintain the original current, and hence ensure that the zeta potential remains accurate.
- Does the system eliminate the effects of electro-osmosis on zeta-potential measurements? Electro-osmosis is where applying an electric field across a high-conductivity solution results in a net flow of charged particles, distorting the zeta potential obtained. Our M3-PALS method solves this by measuring the mobility of the sample at high frequency (where electro-osmosis does not occur), and then using the result to correct the low-frequency measurement.
- Does the software help you to determine the reliability of your results? Wouldn’t it be good if you could check that your results are approximately right before continuing with your analysis? That’s exactly what our ‘Data Quality Guidance’ software does – it uses an automated neural network to assess the raw data against a database of knoAdaptive Correlation improves the repeatability of DLS particle size measurements by classifying rare events attributed to dust, aggregates, or contaminants.
6. Do you need software that makes your life easier, not more difficult?
Many instruments on the market have complex software interfaces that are difficult to learn. But in our ZS XPLORER software for the Zetasizer Advance series, we’ve maximized processing performance while keeping everything easy to use:
• We use a sample-centric workflow that optimizes the measurement settings and offers advice based on your inputs about the sample, measurement conditions and variables required. So, it’s as simple as adding the sample information, choosing the measurement type, and pressing “Run”.
• We’ve made it easier to automate sequence setup, helping you to work more efficiently.
• We convey as much results information as possible graphically, making it easy to see the key facts at a glance, and avoiding long, complex lists.
• Our ‘Data Quality Guidance’ software provides advice on how to correct any problems it identifies in particle-size results, using an automated neural network trained on over 100,000 data sets.
All this enables you to run your samples and analyze your results quickly and easily, whether you’re a new or experienced user. The outcome is faster sample throughput, allowing you to get more done (or go home earlier!). But the best way to see what the software will do for you is to see it in action: why not book a remote demo?wn issues, and it also provides advice on how to correct any issues it identifies. - What ‘behind the scenes’ data can the instrument provide you? In cases where you’re unsure about the reliability of the result, it can be very useful to examine the data closely to see if there are any potential problems. Not all systems do this, but on Zetasizer instruments the software tells you if your measurement suffers from unwanted changes in counts, poor baselining, or poor correlation functions.

Adaptive Correlation improves the repeatability of DLS particle size measurements by classifying rare events attributed to dust, aggregates, or contaminants
6. Do you need software that makes your life easier, not more difficult?
Many instruments on the market have complex software interfaces that are difficult to learn. But in our ZS XPLORER software for the Zetasizer Advance series, we’ve maximized processing performance while keeping everything easy to use:
- We use a sample-centric workflow that optimizes the measurement settings and offers advice based on your inputs about the sample, measurement conditions and variables required. So, it’s as simple as adding the sample information, choosing the measurement type, and pressing “Run”.
- We’ve made it easier to automate sequence setup, helping you to work more efficiently.
- We convey as much results information as possible graphically, making it easy to see the key facts at a glance, and avoiding long, complex lists.
- Our ‘Data Quality Guidance’ software provides advice on how to correct any problems it identifies in particle-size results, using an automated neural network trained on over 100,000 data sets.
All this enables you to run your samples and analyze your results quickly and easily, whether you’re a new or experienced user. The outcome is faster sample throughput, allowing you to get more done (or go home earlier!).
But the best way to see what the software will do for you is to see it in action: why not book a remote demo?

7. Are you tired of continually setting up new calibration curves for particle concentration measurements?
The ability to measure particle concentration (in addition to size and zeta potential) is a useful feature of a couple of systems on the market. But be warned – systems based on light transmission require you to perform a multi-point calibration every time you change the sample type. Not only that, but the results can only be expressed as a percentage of the total concentration (which by definition you don’t know!).
We have a different approach, based on an extension of the MADLS technique that we described earlier (see ‘Multiple angles’ in Section 2). You can read more about how it works here, but the end result is the number of particles per mL for each peak in the size distribution. The MADLS approach doesn’t depend on sample type, and means that you can quickly get particle concentration data for lots of sample types, without the need for calibration. The software also provides guidance to ensure that the particle size data collected is also suitable for determining the concentration.

The MADLS approach combines three independent sets of data, collected at different scattering angles, allowing concentration and particle size to be obtained from bimodal or trimodal samples without the need for calibration.
8. Are you feeling ‘on your own’ in the lab?
Getting good results with DLS/ELS depends on a lot of factors, so think about how much support your system vendor will give you. At Malvern Panalytical, we know that this is important to our customers, and we’re on your side.
As well as in-built ‘help’ in the software that lets you know when measurement data looks wrong, we’re always here to talk through your application, offer advice about your samples,
and help you fix issues. We also offer a ‘smart-install’ option for remote or restricted areas, and provide an extensive library of videos and guidance, together with options for in-person, classroom and remote training.
So think of us as part of your team, always on hand to help you get the job done – whether you’re quite literally in a remote location, or are merely in a lab where no-one else is running DLS or ELS analyses.
With over 40 years’ experience of light scattering, we’re wellplaced to help you navigate some of the complexities of getting good results from size or zeta measurements – just ask us!
Conclusion
It will be obvious to you by now that DLS/ELS instruments are sensitive optical benches, and that the analysis of light scattering is complex. Applications are often varied, and expertise is required both for sample preparation and for analysis.
In addition, as your applications evolve over time, it’s likely that you’ll be looking for higher performance, more advanced features, and expert advice.
So, if you’re considering buying a cheap instrument because “they all seem much the same”, then take a moment to think about how much peace-of-mind is worth to you. It’s true that instruments that come with round-the-clock support, free software updates, warranties, training opportunities and rapid upgrades might cost a little more up-front. But in return you will get better performance and ease-of-use, maximum uptime for routine analysis, and confidence that you’re ready to tackle any challenge.
In this document, we’ve given you some ideas about what features of a DLS/ELS system might be most important for you, and (we hope) also some good reasons to consider a Malvern Panalytical instrument.
If you’d like to talk to one of our specialists, we’re always available for a friendly chat.