Phenol formaldehyde resins are the most common type of phenolic resins used for transportation, electronics, building and construction materials. Triple detection is able to characterize the coiling and branching to order to compare samples.
Phenol formaldehyde resins are the most common type of phenolic resins. They are produced by reacting a phenol with formaldehyde in the presence of a catalyst. Phenolic resins encompass an extensive array of applications, ranging from transportation and electronics to building and construction materials.
In this application a pure phenol formaldehyde resin was modified in four individual different ways with neoprene, which has a very high dn/dc value.
The triple detector system is used for this analysis of modified and unmodified phenolic resins. Conventional methods detect only differences in hydrodynamic size while triple detection measured the molecular weight, the intrinsic viscosity, from which the Mark-Houwink plot can be constructed. Concentration distribution is calculated through the refractometer, viscosity through the Wheatstone bridge viscometer, and absolute molecular weight directly from the light scattering detector.
For the liquid chromatography, the eluent was tetrahydrofuran (THF) the same as the dilution liquid for the polymer. The pump flow rate was constant at 2 ml/min. The injection volume was 100 µL and the concentration injected was about 2%. Three 10 µm packing material columns were used with pores of 10,000 Å, 500 Å and 50 Å.
|
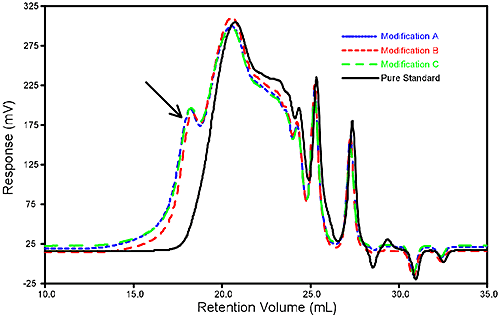
The effects of each modification can be seen in the refractometer overlay shown in figure 1. The original starting product is shown as a solid black line. Note the high molecular weight shoulder added by the three modifications. The high resolution for a fairly low molecular weight species was obtained by careful selecting the columns.
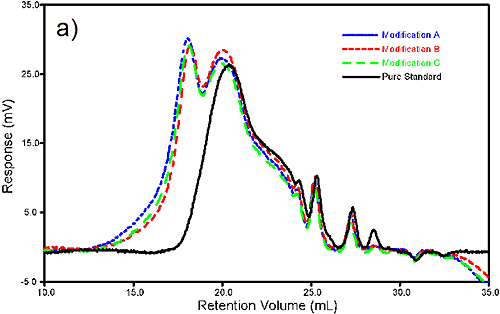
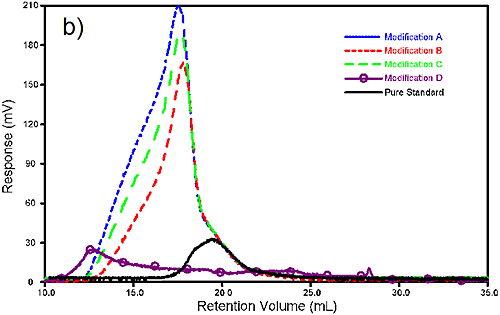
The same high molecular weight shoulder is seen in the viscometer overlay, figure 2a: The light scattering overlay clearly shows the modifications in figure 2b. The peaks of the shoulders of the modified species dwarf that of the starting product. This reflects the fact that light scattering is directly proportional to the concentration but also the molecular weight and (dn/dc)2. A fourth modification was attempted; however it did not dissolve properly due to polymer degradation. This is determined from the light scattering overlay that has a clearly different profile for modification D.
|
|
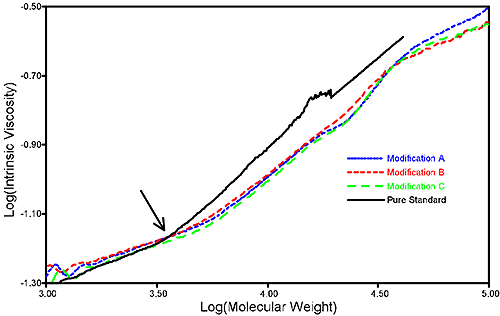
The Mark-Houwink plot overlay, shown in figure 3, tells the story graphically. At the lower molecular weight range, the four species closely resemble one another. However, where the slope of the original standard increases dramatically, those of the modified resins increase only slightly. Since intrinsic viscosity is inversely proportional to molecular density, we can conclude that a species having a lower intrinsic value at a corresponding molecular weight is more highly branched.
|
The triple detection chromatography technique was shown to be able to detect the modification of the phenolic resins. The high molecular weight is easily revealed in the light scattering signal while the viscometer gives information on the partial molar volume occupied by the polymer. Combining the light scattering and viscometric measurements allows the plotting of the Mark-Houwink graph giving information about coiling and branching for easy comparison of the samples.