
Developing better batteries starts with understanding the materials inside them.
This webinar will show how a range of Malvern Panalytical technologies can help scientists, engineers, and battery teams connect key material properties to performance, quality, and manufacturing decisions. The session will introduce practical characterization approaches for battery materials and demonstrate how advanced analytical techniques can provide insights into structural and performance changes in lithium-ion cells during operation.
Who should attend?
- Battery researchers and scientists working with active materials, electrodes, electrolytes, or cells.
- Engineers and technical teams involved in process development, quality control, or scale-up.
- Managers and decision-makers who want a clearer view of which characterization tools support battery development and production.
What will you learn?
- How material properties influence battery performance, consistency, and scale-up.
- Which characterization techniques can help answer common battery R&D and manufacturing questions.
- Learn how advanced characterization methods help connect material properties and structural evolution to battery performance.
Présentateur
- Dr. Dan Evans
Senior Sector Expert - Batteries, Malvern Panalytical
Pour en savoir plus
Your webinar questions answered
Explore answers to questions submitted during the webinar, covering electrode characterization, battery performance, X-ray diffraction, particle sizing, and porosity.
Whole-cell / XRD applications
Q: What is the practical cell thickness limit for the Empyrean when analyzing prismatic or pouch cells?
A: The practical thickness limit depends on the cell format and chemistry. For prismatic cells, a thickness below approximately 3 mm would generally be required. For example, a sodium-ion prismatic cell with aluminum current collectors would be less attenuating than a lithium-ion cell with copper current collectors. In a laboratory setting, attenuation could also be reduced by placing a prismatic jelly roll in a plastic rather than aluminum enclosure. Pouch cells generally have less attenuation because the aluminum pouch is much thinner than the aluminum enclosure of a typical prismatic cell. We have experimentally verified that a 2.5 mm multilayer pouch cell can be measured successfully and produce good data. However, the practical thickness limit still depends on the cell chemistry and the relative thicknesses of the active material and current collector layers.
Q: For these XRD studies, can the whole cell be analyzed without disassembling it?
A: Yes. This is one of the advantages of in operando XRD. The cell can be analyzed in its existing form factor without disassembling it to isolate the electrodes. In the examples shown during the webinar, a standard pouch cell was mounted on the XRD instrument. Using transmission geometry makes it possible to observe the crystalline components within the cell.
Q: Can Malvern Panalytical instruments distinguish between different crystal phases in cathode materials?
A: Yes. Distinguishing crystalline phases is a routine application for our X-ray diffraction (XRD) instruments. With high-quality data, quantitative phase analysis can also be used to determine the relative amounts of the crystalline phases present.
Q:Can XRD mapping be used to compare areas of an electrode over multiple cycles?
A:Yes. Programs can be configured to change the position of the XYZ stage between scans, allowing different areas of the electrode to be mapped. This approach can be used to examine changes in the electrode’s crystallographic state as a function of position.
Q: How can X-ray diffraction (XRD) help optimize prepared electrode materials?
A: XRD can characterize several properties of prepared electrode materials, including phase identity, crystallite size, phase composition through quantitative phase analysis, defects, and microstructure. These measurements provide information to support material optimization. For more information, read how XRD supports better batteries.
Q: Have you compared different materials used as anodes?
A: We have investigated silicon anodes in our laboratory. In my previous role, I also used the Empyrean XRD instrument to study anodes in aqueous pouch-cell systems. Crystalline anode materials can be investigated using XRD. For amorphous anodes, indirect information can still be obtained by examining other cell components, such as the current collectors.
Q: What is required to perform X-ray absorption spectroscopy (XAS) measurements on an XRD diffractometer, and is there a published paper describing the approach?
A: A published paper, “Application of X-ray absorption spectroscopy with a laboratory X-ray powder diffractometer,” describes how this setup can be achieved using the Empyrean XRD system. The approach requires silicon crystals positioned where an XRD powder sample would normally be placed to diffract the absorbed X-rays into the detector. It also requires a powder holder that inserts into the fixed divergence slit optic and a 1Der advanced detector. For operando battery measurements, a dedicated fixture is being developed. Until that is available, the cell can be positioned at the front of the fixed divergence slit optic.
Q: Could a machine learning or artificial intelligence (AI) model predict electrochemical performance from ex situ X-ray diffraction (XRD) data?
A: This is a potential future application. I have used AI models to explore large XRD datasets and identify trends that may not be immediately apparent. In my experience, these models have been useful for finding patterns. A model trained on cell-performance data could potentially help predict how a cell will perform during cycling, although the work I have described here focused on identifying trends rather than validating performance predictions.
Porosity, particle and morphology characterization
Q: What are the respective capabilities and limitations of gas adsorption and mercury porosimetry for analyzing electrode porosity?
A: The most appropriate technique depends on the pore-size range of interest. For microporosity, such as that found in metal-organic frameworks (MOFs) or zeolites, high-resolution argon adsorption combined with density functional theory (DFT) analysis is well suited.
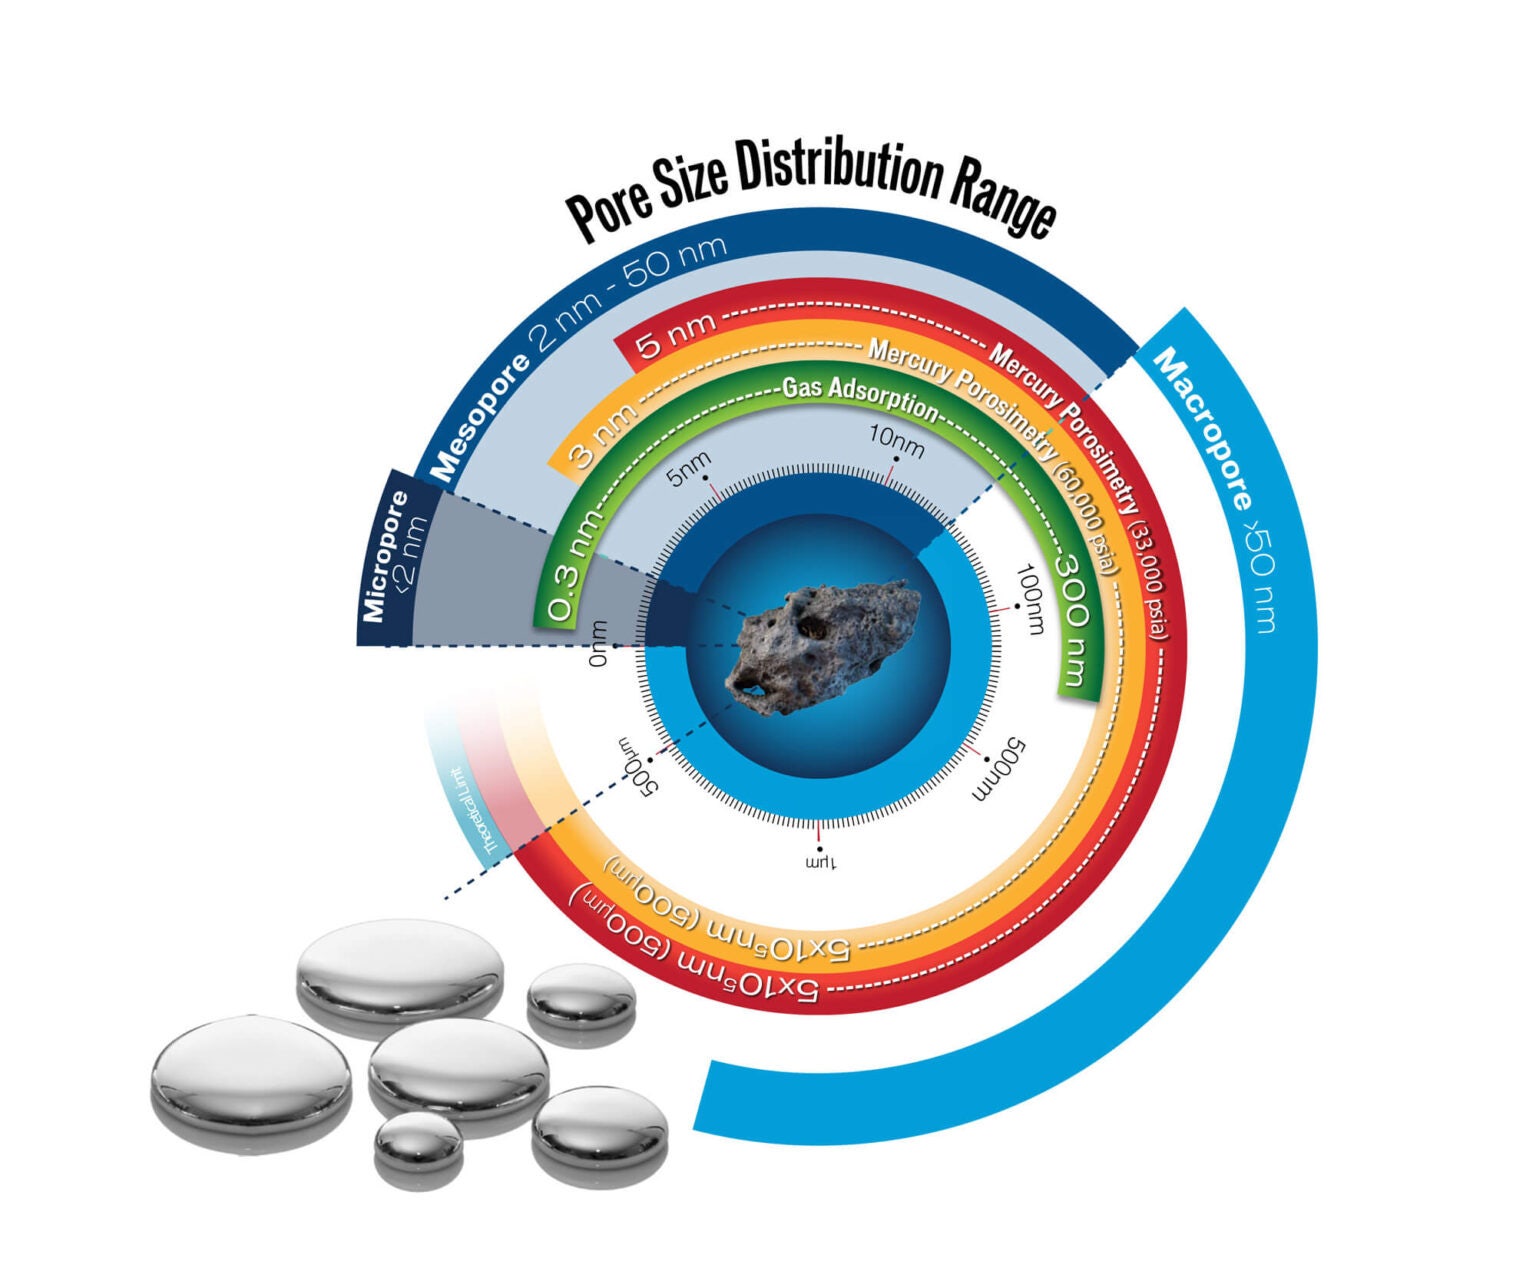
For battery materials, mercury porosimetry can be used to characterize meso- and macroporosity, such as pores found within secondary particles or electrodes. Mercury porosimetry can characterize pores from approximately 3 nm to 500 µm, while gas physisorption can be used for pores from approximately 0.3 nm to 300 nm. The figure below provides a visual overview of the pore-size ranges covered by each characterization technique.
Q: Gas adsorption can characterize accessible open porosity. How can closed porosity be assessed?
A: Closed porosity can be assessed indirectly by comparing the skeletal density measured with the AccuPyc with the material’s true crystal density. The probe gas can enter only pores connected to the surface, so the measured volume includes both the solid material and any closed pores. Closed pores therefore lower the measured skeletal density relative to the true crystal density. The difference between these densities can be used to estimate closed porosity.
Q: How can morphologically directed Raman spectroscopy (MDRS) help characterize electrode powders?
A: The MDRS capability of the Morphologi 4 can be used to examine electrode powders and characterize individual components. This approach is commonly used in the pharmaceutical industry to identify components within a formulated drug. For battery materials, this approach could help distinguish active material, conductive carbon, binders, and other additives by combining particle size and shape measurements with chemical identification using Raman spectroscopy. For more information, watch the MDRS video, or watch the video on YouTube.
Q: Can laser diffraction measure particles in the nanometer range?
A: Yes. The Mastersizer 3000+ can provide accurate particle size measurements over a range of 10 nm to 3.5 mm. For more information, read the Mastersizer 3000+ brochure.
Q: Can XRD and gas physisorption help distinguish mined graphite from synthetic graphite?
A: XRD can quantify the degree of graphitization, which can help distinguish between mined and synthetic graphite. Where possible, it is useful to compare the material with known mined and synthetic graphite standards. Gas physisorption can provide additional insight by comparing edge-plane and basal-plane characteristics. Together, these measurements can help differentiate mined from synthetic graphite.
Q: Can material characterization techniques help identify impurities or abnormalities that may negatively affect battery performance?
A: Yes. Different characterization techniques can identify different types of abnormalities or impurities. XRD can identify unexpected crystalline phases, such as a rock-salt phase of NMC rather than the desired layered NMC structure. X-ray fluorescence (XRF) can identify variations in chemical composition. Morphologi 4 and Mastersizer can also identify oversized or out-of-specification particles when a defined particle size is required for the active material added to a slurry.
Structure and battery performance
Q: How can a first-principles understanding of crystal structure help explain suitability for different applications, particularly in the 2H and 3R example?
A: My interpretation is that the relationship between the 2H and 3R structures and their performance involves a trade-off between stability and lithium accessibility. The 2H structure is typically more stable because it has fewer edge planes and defects that can react with the electrolyte and contribute to solid electrolyte interphase (SEI) formation. However, its less accessible structure can lead to slower lithium diffusion and lower rate capability. In contrast, the 3R structure offers more accessible active sites for lithium diffusion, which can support higher rate capability. The trade-off is that more defects and edge planes can react with the electrolyte, consuming lithium through SEI formation.
Q: How can we understand non-linear, fractional-derivative diffusion behavior that varies even at a fixed state of charge (SOC) and temperature? I have observed this in several chemistries, mainly in anodes. Can morphology measurements or other characterization techniques help predict it?
A: Combining imaging techniques with high-resolution gas physisorption can help relate particle morphology to diffusion behavior. Imaging provides information about particle size and shape, while gas physisorption provides surface area and porosity measurements. Together, these measurements can help build an understanding of diffusion within a material. For example, a larger, highly porous particle may exhibit slower diffusion than a smaller particle with lower porosity and tortuosity.
Q: Which parameters should be monitored to assess battery health and suitability for second-life applications?
A: Delivered capacity can be used to assess a cell’s state of health. The approach discussed here involves measuring the capacity delivered over a full-capacity cycle, rather than the partial depth of discharge typically used in operation. Suitability for a second-life application depends on both the cell’s retained capacity and the requirements of the new application. For example, a cell at 70% capacity retention may be considered at the end of its useful life for one application but still have sufficient capacity for another.
Recycling
Q: How can lithium iron phosphate (LiFePO₄) batteries be recycled, and how can material recovery be improved?
A: Although recycling processes were not covered in this webinar, metals analysis plays an important role in this work. Malvern Panalytical offers X-ray fluorescence (XRF) instruments for quantifying the chemical composition of materials. Explore our XRF spectrometers.