
David Shaw and Paul Dubin, Dept. Chemistry IUPUI Indianapolis USA
In 1934, Palmer first described the separation of ß-Lactoglobulin (ß-Lg) from the whey fraction of bovine milk.1 This discovery was made fifty years before the actual structure could be elucidated through X-ray crystallography.2 The study of aggregation and aggregation kinetics for ß-Lactoglobulin has been the topic of a multitude of journal articles since its discovery. The majority of these studies center around heat induced aggregation since this is of great interest and importance to the processing of dairy products. Despite the years of research, the specific function of ß-Lactoglobulin is yet to be completely understood.3 The purpose of this work is to provide a study of ß-Lg electrostatic aggregation at low ionic strength (I) and at pH values below the isoelectric point (pI) where aggregation occurs at a rate slow enough to be evaluated by quasi-elastic light scattering (QELS).
ß-Lg A&B, purchased from Sigma- Aldrich and used without further purification, was dissolved in 4.5mM NaCl prepared from Milli-Q water. The dissolved ß-Lg was then raised to pH 9 in order to disassociate the protein into its monomeric species.4 An equal volume of 4.5mM NaCl was prepared containing the appropriate amount of 0.1M HCl to bring the combined solutions to the target pH and concentration of 4.2 and 1mg/mL respectively. Both solutions were filtered (0.2 μm filters, Sartorius AG, Germany), and then mixed immediately prior to analysis.
Size distributions of the ß-Lg aggregates were determined using the Malvern Zetasizer Nano ZS. Correlation times were seven seconds per run and three runs per measurement. QELS was used to determine size distributions over fifty minutes.
|
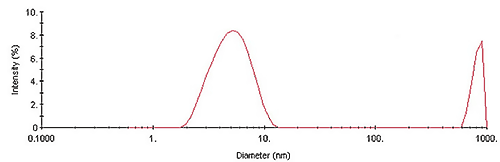
Figure 1 shows the intensity size distribution collected during the kinetic experiment at time (t) = 0. As evident here, the QELS results indicate that, ß-Lg aggregates in two distinct size populations almost immediately.
The smaller size population has a hydrodynamic diameter of circa 5.4nm. Using a know mass vs. size relationship for globular proteins, shown in Equation 1, the molecular weight of the 5.4nm protein is approximately 35 kDa, consistent with the dimeric form of the ß-Lg protein.
MW (kDa) = (1.68*RH)2.3394 (1)
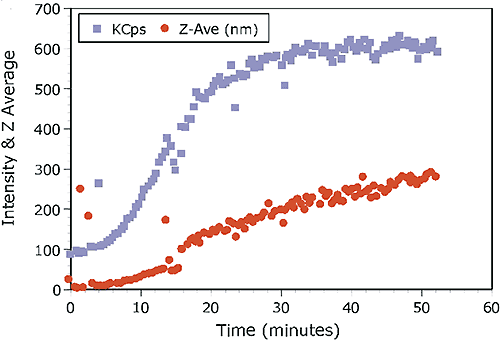
The kinetic trace for the experiment is shown in Figure 2, which shows the intensity and Z-Average diameter as a function of experimental time.
|
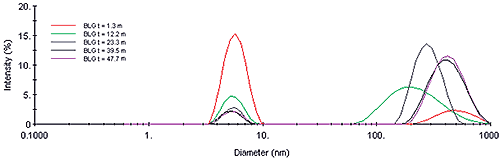
The scattering intensity is roughly proportional to the concentration and the square of the molecular weight, and is hence quite sensitive to the formation of higher order aggregates. The Z-Average diameter is the mean diameter of the ensemble of particles, and is derived from the slope of the linearized form of the correlation function (Cumulants method). As seen in Figure 2, the formation of the higher order aggregate occurs in the first 20-25 minutes of the experiment. At longer times, the scattering intensity is relatively constant, suggesting that dimer-aggregate equilibrium has been achieved. Stabilization of the higher order aggregate at longer times is also evident in Figure 3, which shows selected intensity size distributions from the kinetic experiment.
|
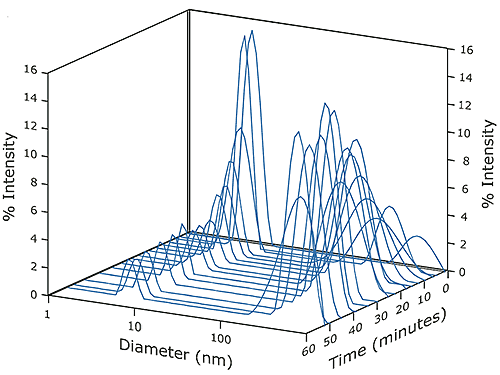
A decrease in the relative amount of dimer was also observed over the time course of the experiment. At the initial conditions, shown in Figure 1, the dimer concentration accounted for 80% of the scattering intensity. At the conclusion of the experimental run, the contribution to scattering intensity by the dimer had stabilized at roughly 10% of the total (see Figure 4). As seen in Figure 4, an increase in scattering intensity and size stabilization of the super aggregate could also be seen over time. The scattering intensity of the aggregate increased from 20% to 90% during the run, with the size of the aggregate ultimately stabilized at approximately 425nm.
|
1. Palmer A.H., J. Biol. Chem., 104 (1934) 359-372.
2. Newcomer M.E., Jones T.A., Aqvist J., Sundelin J., Erikkson U., Rask L., Peterson P.A., EMBO J., 3 (1984) 1451-1454.
3. Sawyer L., Kontopidis G., Biochimica et Biophysica Acta, 1482 (2000) 136-148.
4. Lametti S., Scaglioni L., Mazzini S., Vecchio G., Bonomi F., J. Agric. Food Chem., 46 (1998) 2159-2166.