
In collaboration with UFT, Bremen, Germany
Chitin is one of the most abundant natural materials in the world. It is a linear polysaccharide that composes most of the exoskeleton of anthropods and the radula of molluscs. Chitin is insoluble in pure water but once deacetylated, the resulting form can be dissolved in acetic acid. Deacetylated chitin is called chitosan.
Chitosan is bio-degradable over time, making it an inexpensive and abundant eco-friendly material. Chitosan has already found many uses such as:
Despite the potentially very important uses of chitosan, the commercially available materials are poorly defined analytically. The preparations available commercially and described in the literature do not correlate the degree of acetylation or acetylation fraction (FA) with molecular weight or other macromolecular properties. This application note explains why batch solution viscosity data cannot be used to estimate the molecular weight of chitosan. A method is presented to determine molecular weight, distribution, viscosity and size. In addition, the molecular weight dependent conformation of chitosans from various sources and two different origins is shown.
Six chitosans from various sources were obtained. They were labeled as follows; chitosan C and chitosan D were purchased from Chipro (Bremen, Germany) with a degree of acetylation of 6% and 12% respectively. Chitosan H at 5% acetylation was received from EUTEC (Emdem, Germany). Chitosan P from Sigma-Aldrich had 4% acetylation while chitosans AF and AQ with 9% and 11% acetylation respectively were acquired from Heppe-Medical-Chitosan HMC (Halle, Germany). The degree of acetylation was determined by 1H-NMR measurements as explained in reference 1.
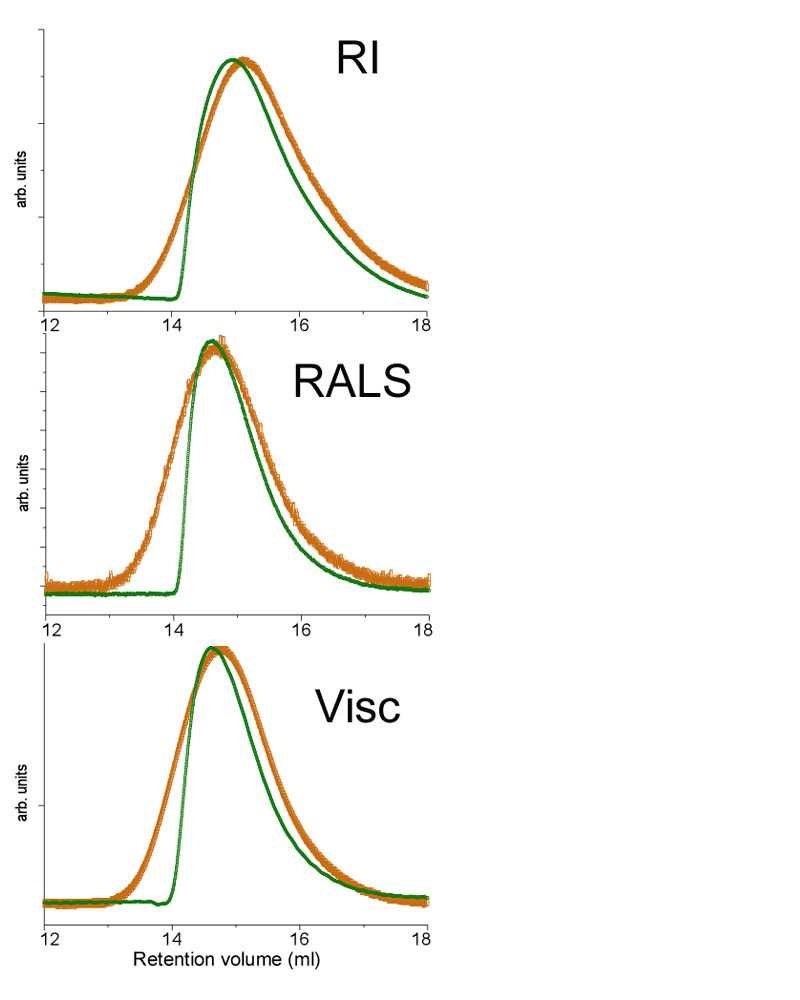
Chitosan forms a superstructure with hydrogen bonds at many points, creating the equivalent of a reversible cross-linked polymer. The superstructure can become very large with masses above 100,000 Daltons (Da). Therefore, to dissolve chitosan, these hydrogen bonds need to be broken so it can be solubilized, albeit slowly, in acetic acid. The complete dissolution of large polymers can only be achieved with long dissolution times. A chitosan of molecular weight of 500,000 Da was dissolved for 24 hours under light shaking. The sample was filtered using a 0.45 µm filter before being analyzed. Figure 1 presents the raw traces from triple detection size exclusion chromatography (TD-SEC) for this chitosan. The orange traces are for the injection made after 24 hours dissolution. The green curves represent the same solution but filtered after only 4 hours dissolution.
|
The differential refractometer signal (RI) is proportional to the concentration of chitosan. Both traces have been normalized to take into account the change of concentration between 4 and 24 hours dissolution. For SEC, the larger molecules elute faster than smaller molecules. The x-axis in figure 1 is the retention volume which is proportional to the elution time. Larger chitosan molecules elute around 13 mL while smaller species elute at higher retention volumes, in this case up to 18 mL. It is clear that the portion of smaller size chitosan molecules, at higher retention volumes, are very similar in figure 1, indicating that lower molecular weight chitosans are already in solution after 4 hours of dissolution. The left side of the peak is totally different for the 4 hour and 24 hour traces, with the orange curve showing a more symmetrical shaped peak, indicating a full dissolution. The green trace shows a sharp drop on the left side of the peak, indicating that some material is missing; in this case, it is the high molecular weight fraction of chitosan that is not dissolved after 4 hours. The second trace in figure 1 is from the Right Angle Light Scattering (RALS), a detector that is sensitive to concentration and molecular weight, hence the left shift of the peak compared to the RI signal. In this trace the green deformation is even sharper due to the missing high molecular weight fraction. The third trace is from the differential pressure transducer of the Viscotek viscometer detector. This signal is proportional to the viscosity of the sample. The viscometer signal shows a similar behavior.
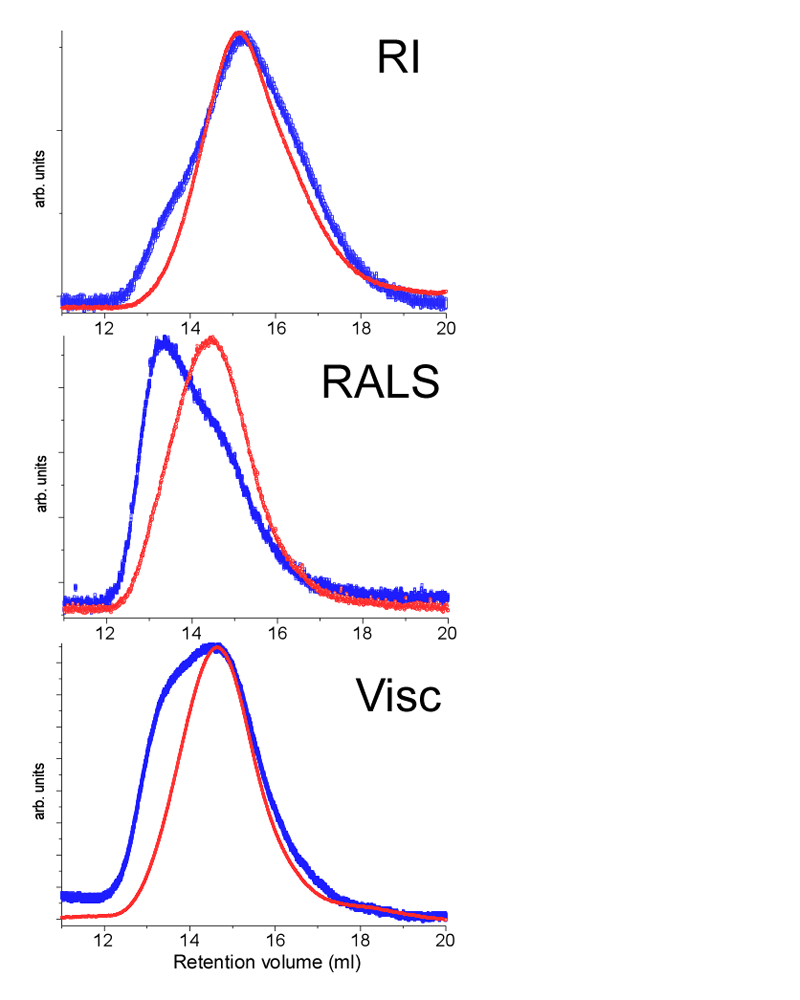
Based on this information, all the chitosan samples were left to dissolve under light shaking for a period of 24 hours before analysis. Filtered and unfiltered samples were injected in the TD-SEC system. Figure 2 shows the different chromatographic traces for the unfiltered (blue) and the filtered (red) injections. The red curves all show a single monodisperse population of chitosan after filtration. The blue curve from the RI detector shows a slight shoulder in the left part of the peak, indicating a population of higher molecular weight in the unfiltered sample. These two populations become clear in the RALS traces due to the weighting of the detector response. The viscosity traces also are very different before and after filtering. In light of these results all the samples were filtered using a 0.45 micrometer syringe filter.
|
In order to determine accurately the molecular weight using light scattering a reliable refractive index increment, dn/dc, is essential. The TDAmax system can be used to measure the value of dn/dc if 100% recovery of the sample is achieved. Since chitosan does not dissolve completely and material is left behind when filtering, the RI detector cannot be used in this case to accurately determine the value of dn/dc. Impurities and differences in the chitosan composition can also influence the value of dn/dc. Published values varying from 0.142 to 0.208 were found in the literature for chitosan, a rather wide range of values. The value of dn/dc is solvent, wavelength and temperature dependent, but for aqueous based chitosan measurements, the values are not expected to change more than 5% with the different laser wavelengths and even less with temperature. This large variance in published values is unexplained, but if full sample recovery or dissolution is not achieved, this will lead to an overestimated value of dn/dc. Values of dn/dc for similar structure polymers; alginate, amylopectin, amylase, carboxymethylcellulose, carragenan, ethyl cellulose, hyaluronic acid and starch were found to be in between 0.140 and 0.176. A value of 0.163 cm3/g, reported by Rinaudo et al. was used for the analysis.
Results from triple detection chromatography of the six chitosan samples are presented in table 1. The data is separated into two groups. The first three samples show a comparable fraction of acetylation of about 0.05 but have different molecular weights. The weight average molecular weight of this first group ranges from 170 to 310 kDa. The second group of three chitosans have a fraction of acetylation of around 0.10, with weight average molecular weights from 151 to 611 kDa.
| Chitosan | Origin | Mn
(kDa) | Mw
(kDa) | Mw/Mn | [η]
(dL/g) | Rh
(nm) | FA |
|---|---|---|---|---|---|---|---|
| Chitosan C | Crab | 53 | 170 | 3.2 | 3.1 | 18.2 | 0.06 |
| Chitosan H | Squid | 88 | 286 | 3.3 | 5.1 | 25.8 | 0.05 |
| Chitosan P | Crab | 131 | 310 | 2.4 | 6.7 | 29.8 | 0.04 |
| Chitosan AF | Crab | 56 | 151 | 2.7 | 3.3 | 18.3 | 0.09 |
| Chitosan D | Crab | 54 | 159 | 2.9 | 3.6 | 18.9 | 0.12 |
| Chitosan AQ | Crab | 288 | 611 | 2.2 | 12.1 | 46.4 | 0.11 |
To monitor the impact of the source of chitosan on the physical parameters, crab chitin and chitin from the squid beak were selected. No major difference in size or molecular weight distribution was found between the two different sources of chitosan.
The different chitosan samples studied had very different weight average molecular weights (Mw) ranging from 151 to 611 kDa. The polydispersity of all the samples ranged from 2.2 to 3.3, indicating a largely consistent polydispersity for all the samples. Neither the molecular weight nor the polydispersity correlated with the fraction of acetylation. It is therefore possible to obtain samples with low acetylation and high molecular weight like chitosan P or fairly high acetylation fraction like the chitosan D with low molecular weight.
The intrinsic viscosity of the chitosan samples were measured and are also presented in table 1. As expected, the intrinsic viscosity is small for low molecular weight and large for high molecular weights. From the measured intrinsic viscosity and molecular weight, the hydrodynamic radius was calculated assuming a spherical conformation. Again, the size measured correlates well with the molecular weights, the lower molecular weight samples are smaller than higher molecular weight chitosan.
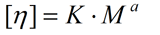
The intrinsic viscosity [η] measured in a specific solvent is related to the molar mass M by the empirical Mark-Houwink equation.
|
The Mark-Houwink constants K and a are characteristic of the polymer-solvent system. For a simple polymer-solvent system, the plot of log [η] vs Log M gives a straight line with the slope being a and the intercept log (K). The slope, a, reveals information about the polymer conformation in solution. The slope can vary from 0 for compact spheres to a value between 0.65 to 0.85 for random coil to the extreme value of 1.8 for a very stiff chain.
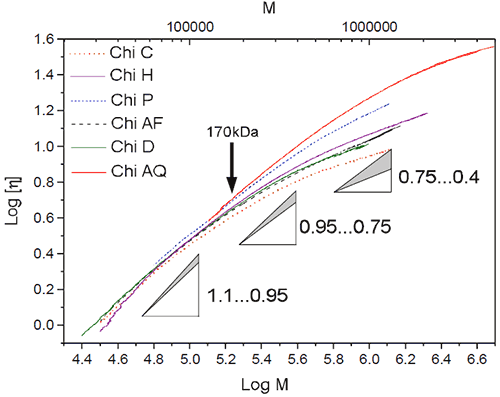
Using the triple detector system, the viscosity as well as the molecular weight was measured for each elution slice. The Mark-Houwink plot (M-H plot) is given for all the chitosan samples in figure 3. For molecular weights below 170 kDa, the slope of the M-H plot varies from 0.95 to 1.1 for all chitosans, indicating similar densities/coiling. The difference in slope is noted for molecular weights above 170 kDa where there is a curvature in the M-H plot. The change of slope is due to a change of polymer coiling at high molecular weight. It should be noted that this change is gradual. The same type of behaviour is noted in polymer branching and in high molecular weight intramolecular interaction. The fact that higher molecular weights have a smaller slope, a, indicates tighter coiling.
|
Previous publications dealing with conformational analysis of chitosan used only a limited range of molar masses. The Mark-Houwink plots presented in these publications showed an almost linear slope. There are many values of K and a published in the literature. Their values vary greatly depending on the molar mass fraction used, as expected from the curvature at large molecular weight range presented in figure 3.
Although chitin is known to be a linear polymer, the reaction conditions required to produce chitosan (strong alkali, high temperature) may get the chitosan to branch or more likely form intramolecular interactions for large molecular species as shown by the Mark-Houwink plot.
The accurate molecular weights and molecular weight distributions were measured using triple detection. The degree of acetylation did not correlate with the molecular weight, inferring that it is possible to have highly acetylated chitosan with low or high molecular weights. The viscometer was used to correlate the molecular weight to the size of the chitosan, where higher molecular weight samples all showed higher density. This proved that the use of conventional viscometric measurements of chitosan to estimate the molecular weight using Ubbelhode-type viscometer are flawed as the M-H curve exhibits a curvature. The triple detector was used to study successfully the molecular weight and conformation of chitosan.
Triple detection size exclusion chromatography (TD-SEC) was performed using a Viscotek TDAmax system at 30 °C with two Viscotek ViscoGEL columns connected serially. The mobile phase was 0.3 M acetic acid / 0.3 M sodium acetate buffer (pH - 4.5) with 1% ethylene glycol. The eluent was filtered using a 0.2 µm filter to ensure a low scattering signal from the mobile phase. All the chitosan samples were prepared at concentrations from 0.3 to 1 mg/mL, dissolved for 24 hours under light agitation and then filtered using a 0.45 µm filter prior to injection. The injection volume varied from 10 to 100 µL. The flow rate was fixed at 0.7 mL/min. Calibration of the system was made using a PEOx standard (Mw = 22,411 Da, [η] = 0.384 dL/g, Mw/Mn =1.03). For all the calculations, a dn/dc of 0.163 was used for chitosan.
1- M. X. Weinhold, J. C. M. Sauvageau, N. Keddig, M. Matzke, B. Tartsch, I. Grunwald, C. Kübel, B. Jastorff and J. Thöming, Green Chem., 2009, 11, 498
2- M. Rinaudo, M. Milas, and P. Dung, Int. J. Biol. Macromol., 1993, 15, 281-285