The correct operation of the fuel injection system in a reciprocating engine is critical to the control of the engine's efficiency, power output and the production of harmful emissions. The injection system controls the volume of fuel injected into the combustion chamber, dependent on the engine load, ambient temperature and pressure, as well as the engine temperature. Once the fuel is released, the efficiency of its combustion is determined by the size of the droplets produced by the nozzle. Efficient combustion requires the fuel to be vaporized within a very short time. Smaller droplets have a greater surface area, so reducing the droplet size can increase the rate of vaporization. However, in applications such as manifold port injection, this requirement is balanced against the requirement for the spray to penetrate into the cylinder head. Often, increasing the droplet size can improve the penetration of the spray and in turn improve the mixture.
Control of the droplet size is therefore essential in order to control both the fuel mixing process and evaporation rate. Both of these processes are related to the release of harmful emissions, low fuel consumption and engine power output.
Direct injectors have become standard across most of the automotive industry. This type of injector is designed to improve the penetration of the droplets into the combustion chamber, which reduces impingement on the walls of the cylinder block and improves mixing.
In a direct injector, the injector nozzle is installed at the top of the combustion chamber. Fuel is released into the combustion chamber as a conical liquid sheet, with the flow being controlled by either a piezoelectric or solenoid valve.
Atomization of the fuel is achieved using the kinetic energy of the fuel as it passes through the nozzle. Increasing the pressure of the fluid increases the available energy, reducing the size of the droplets produced. However, there are practical limits on the pressure which can be used. Firstly, cavitation can occur at high pressures, where turbulent flow causes gas bubbles to be produced in the pressurized fuel. These bubbles can affect the process of liquid atomization and reduce the volume of fuel passing through the nozzle. Secondly there is a limit on the amount of energy (and its associated cost) that can be used to pressurize the fluid in the pumping system.
The amount of fuel released is set by the valve opening time. This is determined by the engine control unit (ECU) based on measurements of the engine load, intake airflow, ambient temperature and pressure. Typical injection times range from 0.2 to 10ms.
It is the length of time of each injection cycle which is the main challenge associated with characterizing the size of the droplets produced by fuel injection systems. In order to look, in detail, at the profile of each injection event we need to be able to acquire data at very high speed.
Laser diffraction is an extremely well established technique for droplet size analysis. Size information is obtained using the angular dependence of light scattered from droplets in a laser beam. The general principles and expected instrument performances are covered by an international standard [1].
The Spraytec applies the principles of laser diffraction to the particular challenges of measuring fuel sprays:
In this application note, the droplet size distribution produced by a fuel injection system has been measured at a range of fuel pressures, from 5 bar to 40 bar. At each pressure the droplet size was measured over 25 injector cycles. The ability of the Spraytec to capture data at 10 kHz proves invaluable in allowing the detailed variations within each cycle to be observed.
In most measurements of fuel injection systems, a certain amount of temporal averaging is required. Temporally-averaged size distributions may be sufficient for initial testing, and are useful for assessing repeatability. However, the ability to capture time resolved information can be extremely important to understanding how the nozzle performs and therefore to improving the nozzle design.
In some injection systems, large droplets can be formed by the atomization of liquid remaining in the nozzle from previous injection cycles. These droplets characteristically arrive at the beginning of the pulse, before the main part of the spray plume, or at the end part of the injection. Improvements to the nozzle design [i.e. by removing any areas which may retain liquid] can reduce the occurrence of these large droplets [2].
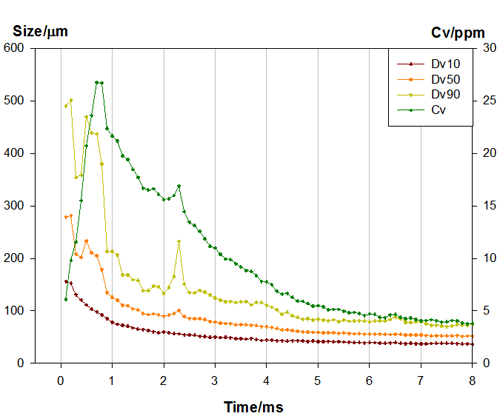
An example particle size history for a single injection is shown in figure 1. In this example, data was acquired at 10 kHz, producing a particle size distribution every 100μs. The resulting particle size history shows features relating to the operation of the nozzle in the particle size and volume concentration on timescales of well under a millisecond. The result confirms that large drops are produced at the beginning of the injection cycle, and that the particle size rapidly decreases beyond this as the flow through the nozzle stabilizes.
|
Once the data has been recorded, the interpretation of the particle size data for fuel sprays can still be challenging due to the volume of data obtained. In this particular experiment each injection cycle lasted between 20 and 30 ms, generating between 200 and 300 particle size distributions (or records) for each pulse. Each experiment therefore yielded 7000 records, from which it is important to be able to quickly and easily obtain the relevant parameters relating to the injector performance.
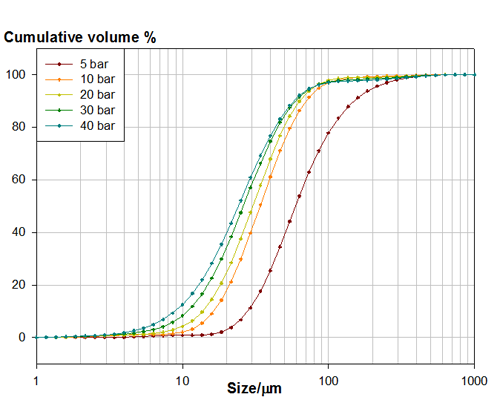
The first and simplest analysis set is to average all of the data from all 25 injection cycles. This produces an average particle size distribution for each pressure, shown in Figure 2. From this it can be seen that as the pressure of the fuel increases the particle size produced by the nozzle decreases. This relates to the increase in flow rate through the nozzle at high pressures.
|
By creating an average over all 25 pulses, the temporal resolution of the data is lost. This information may be important to understanding the function of the nozzle and therefore improving the nozzle design. To produce averaged data without losing temporal resolution, an ensemble average can be used. This averaging process allows the average and standard deviation of the Dv50 (or any other size distribution parameter) to be calculated for the same time point across multiple spray pulses, and therefore highlights where atomization is most variable during the injection cycle.
The process of creating an ensemble average begins by determining the starting point and duration of each injection cycle, normally based on the time of the trigger used to start each measurement. Taking the first time point (relative to the trigger) from each of the 25 pulses and averaging it creates the first point in the ensemble average. This process is then repeated for each time point up to the end of the event. Putting all of these average particle size distributions together produces an average particle size history, in this case generated from the data in all 25 injection cycles.
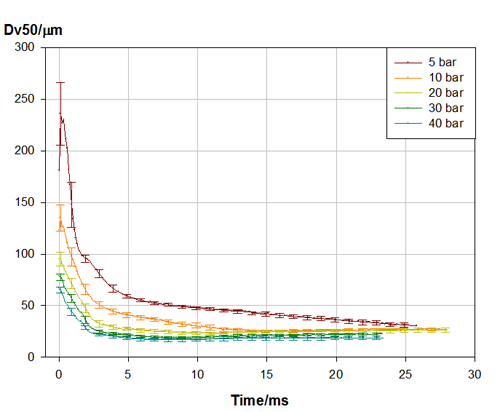
The ensemble average of the Dv50 measured at five different pressures is shown in figure 3. From these ensemble average profiles, the way that the Dv50 varies with time at increasing pressures can be investigated. These data show how the initial size is much larger and more variable at lower pressures. It also takes longer for a stable particle size to be achieved. As the pressure increases, the initial size becomes smaller and less variable. At higher pressures the time taken to reach a stable particle size is also reduced.
|
Temporally averaged data can be important in allowing the consistency of atomization to be assessed. This is achieved using a timed average function in the Spraytec software. This function generates an average particle size distribution for each injection cycle, allowing the variability of the nozzle to be investigated.
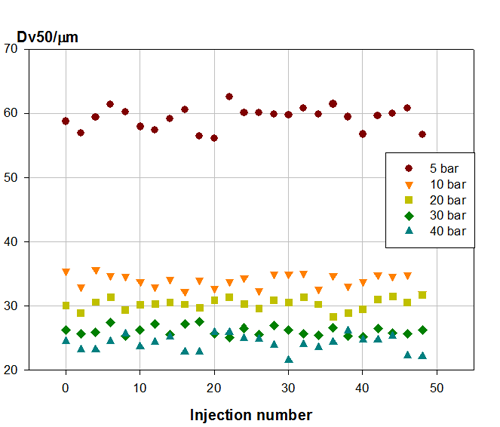
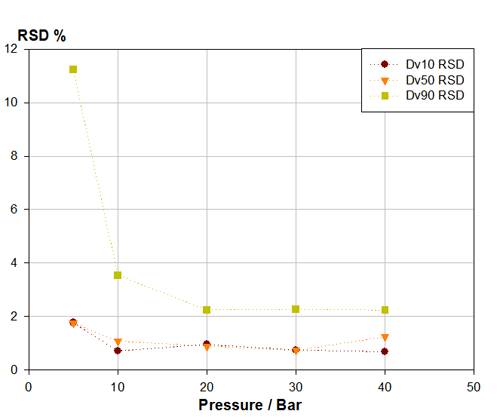
Using the timed average the variation of Dv50 over the 25 pulses (at a range of pressures) can be investigated, as shown in figure 4. At lower pressures there is a greater degree of variability, as the nozzle is working at less than its optimum flow rate. This is shown more clearly in figure 5, where the Relative Standard Deviation (RSD) for the Dv10, Dv50 and Dv90 reported at each pressure is shown. As the pressure is increased, the RSD reduces. In some cases there is a small increase in variability for the Dv50 at the high pressures. This may relate to the degradation of the spray profile at higher pressures caused by the onset of cavitation within the nozzle.
|
|
The droplet size distribution produced by a fuel injector has been investigated at a range of injection pressures. Measurements carried out at different pressures have shown that as the pressure increases the droplet size decreases.
Using the Spraytec to acquire data at 10 KHz has allowed variations in the concentration and particle size to be resolved within each cycle. The ensemble averaging function has shown how the variation of the droplet size within all of the pulses changes with pressure. This kind of information could prove extremely important and time saving in the development of a nozzle.
The variability in the particle size at each pressure has also been investigated by averaging the data from each pulse. This shows a general decrease in variability as the pressure was increased.
[1] ISO 13320-1 Particle Size Analysis- Laser Diffraction Methods Part 1: General Principles (1999)
[2] Application of a High Temporal Resolution Laser Diffraction Technique to the Characterization of Gasoline Direct injection Sprays - D. Robart, R, Kneer, M C Lai.