Inkjet printing of polymer solutions is an area of interest for depositing precise, high-throughput patterns of functional polymer. The applications of the polymer patterns include OLEDs, organic circuits, and textiles. The efficacy of this printed pattern can be negatively impacted by the concentration and viscosity of the polymer solution, the molecular weight and molecular weight distribution of the polymer, and level of branching in the polymer. Therefore, it is of keen interest to understand the effect of inkjet printing on the degradation of polymers. In this application note, the molecular weight (MW) and molecular weight distribution (MWD) of various polymers is shown as a function of time during inkjet printing. The data shown in this application note is from references [1-2].
Two different Malvern Viscotek Size Exclusion Chromatography (SEC) systems were used to characterize the polymers after various durations of inkjet printing. The front end of both systems was a Malvern Viscotek GPCmax that includes an autosampler, low pulsation isocratic pump, and an online eluent degasser. One system was comprised of a single Malvern Viscotek refractive index (RI) detector. This system ran THF as the mobile phase, was calibrated with a series of poly(methyl methacrylate) (PMMA) standards, and was used for the analysis of the polymer MW and MWD with inkjet printing time. This system is commonly referred to as a Conventional Calibration system and will only report MW’s and MWD’s relative to the chemistry of the standard (PMMA in this case).
The other system was comprised of a Malvern Viscotek TDA305 system with RI, viscometer, and light scattering detectors. This system ran MEK as the mobile phase, was calibrated with a single PMMA standard, and was used to characterize the degree of branching in the polymers and verify the MW’s calculated with the first system. This system is commonly referred to as a Triple Detection system and will report not only the MW and MWD, but also the intrinsic viscosity (IV) by incorporating the information from the viscometer detector. Using the light scattering detector, the MW and MWD calculated are considered “absolute” MW in that they are independent of the chemistry and structure of the standard. By combining the information from the viscometer and light scattering detectors, branching information can be determined.
Six polymers were used in this study. A summary of those polymers can be found in Table 1 below. LB, MB, and HB refer to the relative level of branching in the samples (low branching, medium branching, and high branching).
Polymer | Mn (kDa) | Mw (kDa) | PDI |
|---|---|---|---|
PMMA 90 kDa | 45 | 90 | 2.00 |
PMMA 310 kDa | 103 | 310 | 3.01 |
PMMA 468 kDa | 140 | 468 | 3.34 |
LB | 12 | 113 | 9.42 |
MB | 26 | 360 | 13.85 |
HB | 90 | 609 | 6.77 |
Figure 1 shows the effect of inkjet printing time on the weight average MW (Mw) for samples PMMA 90 kDa, PMMA 310 kDa, and PMMA 468 kDa.
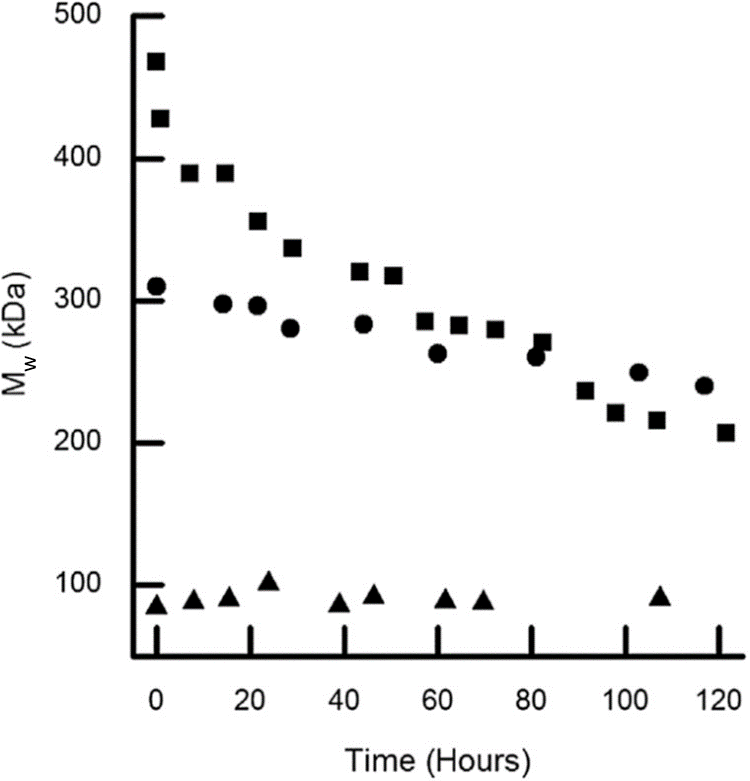
Figure 1. Molecular weight of samples PMMA 90 kDa (▲), PMMA 310 kDa (●), and PMMA 468 kDa (■) as a function of time during inkjet printing [1].
It is readily apparent that sample PMMA 468 kDa markedly degrades, while sample PMMA 90 kDa does not degrade much if at all. Samples PMMA 310 kDa and PMMA 468 kDa appear to converge in Mw at longer times in the experiment. From this we can determine that polymers with higher MW’s will degrade more rapidly than lower MW. Figure 2 looks into that further by analyzing how the MWD changes with inkjet printing time. The largest chains appear to degrade initially, followed by smaller chains, until the distribution appears to stabilize above ~ 200 hours of printing.
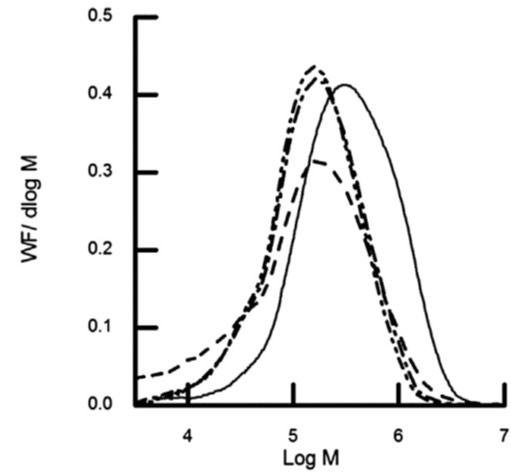
Figure 2. Molecular weight distribution of sample PMMA 468 kDa when printed for a period of 0 (solid line), 150 (---), 200 (.-.), and 250 h (..-..) [1].
The researchers also studied the effect of branching on the MW degradation with inkjet printing time. As a baseline for these tests, the researchers wanted to understand the differences in the degrees of branching between the samples PMMA 468 kDa, LB, MB, and HB. Triple Detection GPC can be used to visualize and quantify these differences in branching by plotting the data obtained on a Mark-Houwink plot (see example in Figure 3). The Mark-Houwink plot displays the IV as determined by the viscometer detector as a function of the MW as determined by the light scattering detector.
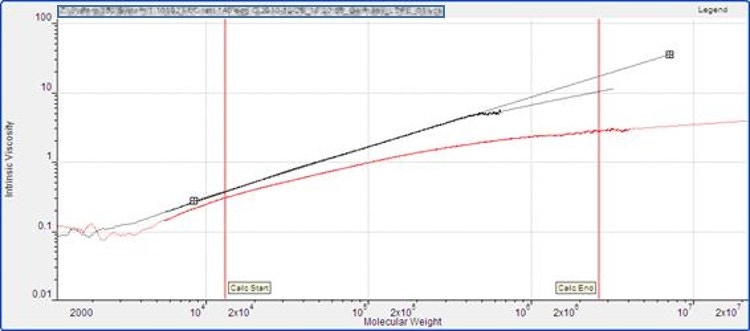
Figure 3. An example Mark-Houwink plot showing IV as a function of MW for a branched sample (red) and a linear reference (black). Quantitative branching information can be calculated from the difference between the sample and the reference.
Qualitatively, more highly branched samples will be closer to the bottom right of the graph while more linear samples will be towards the upper left. By comparing these curves to a known linear reference (either run on the GPC or from known Mark-Houwink parameters), one can quantify the number of branches, branching frequency, and g’ (ratio of branched and linear IV’s). By employing triple detector GPC, the MWD and g’ of these samples were determined and shown in Figure 4a and 4b, respectively.
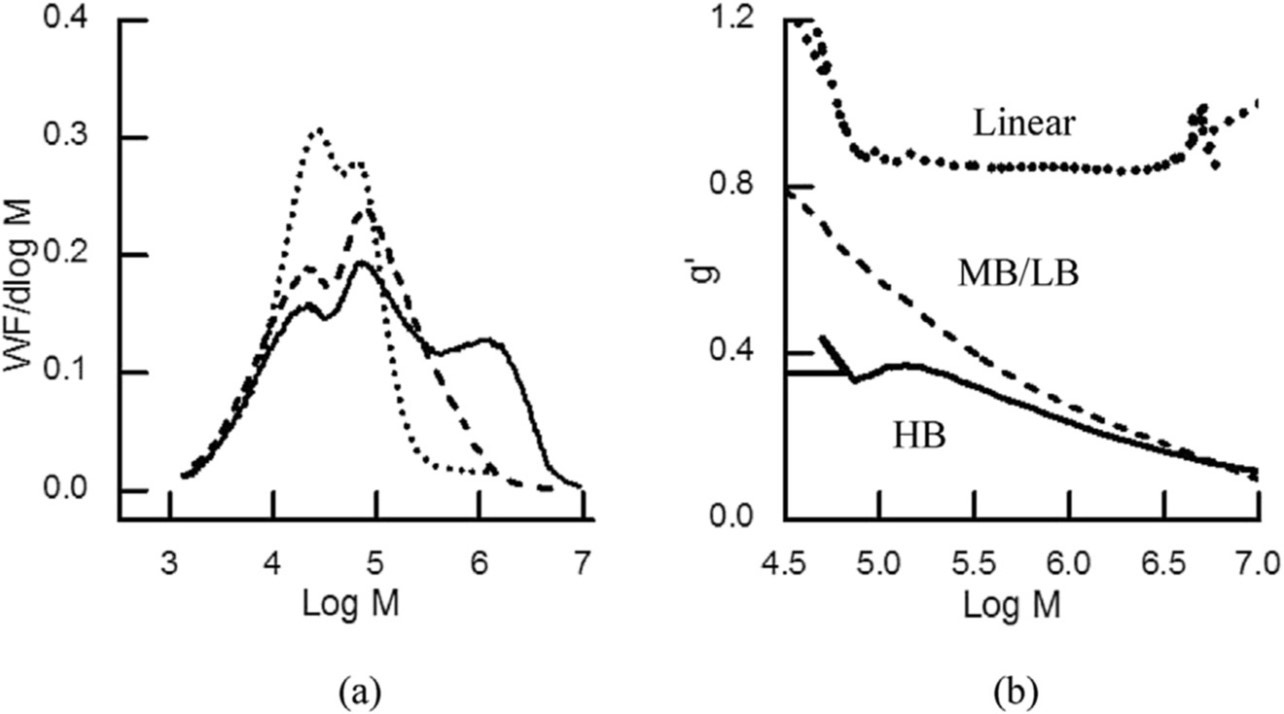
Figure 4. a) Molecular weight distributions of samples LB (...), MB (---), and HB (solid line); b) g' for linear sample PMMA 468 kDa (...), branched samples LB and MB (---), and branched sample HB (solid line) [2].
As expected, the linear sample showed a g’ near 1 while the branched samples had progressively lower values with increasing level of branching. The broad and multi-modal MWD seen in Figure 4a are more typically seen with highly branched samples.
By analyzing the MW of polymers after inkjet printing for various amounts of time, researchers were able to determine how inkjet printing degrades polymers. The researchers of the two papers referenced studied how the starting MW of the polymer affected the rate of degradation and how the degree of branching affected the rate of degradation.
Conventional calibration GPC can quickly and effectively analyze the MW and MWD of similar polymer samples for comparison purposes. This works very well for analyzing polymer degradation over time.
Triple detection GPC can analyze a wide variety of polymers (similar or not) and obtain a wealth of information including, but not limited to, MW, MWD, IV, and degree of branching. This works very well for comparing polymers with different chemistries or widely different structures.
1. Wheeler, Joseph S.R., Stuart Reynolds, Steven Lancaster, Veronica Sanchez Romanguera, and Stephen Yeates. "Polymer degradation during continuous ink-jet printing." Polymer Degradation and Stability. 105. 2014. pp. 116-121.
2. Wheeler, Joseph S.R., Amelie Longpre, Daniel Sells, Daryl McManus, Steven Lancaster, Stuart Reynolds, and Stephen Yeates. "Effect of branching on degradation during inkjet printing." Polymer Degradation and Stability. 128. 2016. pp. 1-7.