For this study, we used the generic Rietveld quantification file for clinker for the determination of relative changes and additionally the internal standard method for a detailed look at the amorphous content and the real changes in the material. The results of both techniques were compared.
It is well known, that the sample preparation has a strong influence on the results of mineralogical quantification using X-ray diffraction (XRD). Especially weak minerals can be easily destroyed during grinding and a quantification is then impossible. However, also hard materials like clinker can undergo significant changes in phase content during sample preparation with widely used industrial mill / press machines.
It is well known, that the sample preparation has a strong influence on the results of mineralogical quantification using X-ray diffraction (XRD). Especially weak minerals can be easily destroyed during grinding and a quantification is then impossible.
However, also hard materials like clinker can undergo significant changes in phase content during sample preparation with widely used industrial mill / press machines.
For phase identification and quantification of a clinker by X-ray diffraction it is necessary to mill the sample and press it into a sample holder. A wrong preparation procedure can change the material: particle and crystallite size are decreasing, amorphous material can be produced and preferred orientation effects can be seen. Such errors introduced by sample preparation influence the quantitave results and cannot be corrected by a perfect analysis.
For a precise process control it is important to determine the original phase composition of the sample.
To optimize the sample preparation, a detailed study of its effect on the quantification of the clinker phases was performed. Sample preparation conditions are especially important if the same sample is used for XRD and XRF measurements.
For this study, we used the generic Rietveld quantification file for clinker for the determination of relative changes and additionally the internal standard method for a detailed look at the amorphous content and the real changes in the material. The results of both techniques were compared.
Sample preparation conditions have an enormous influence on the phase content of clinker and a bad sample preparation cannot deliver good quantification results. Rietveld quantification with the standard clinker control files shows significant changes in the material dependent on the milling conditions.
Intense milling results in an underestimation of alite and free lime, and an overestimation of belite and ferrite concentrations compared to the original clinker composition. Milling of clinker produces amorphous material within a short time. The main total contribution comes from alite, however, by relative percentage free lime is the most affected phase.
Milling speed is the most critical parameter followed by milling time. The pressing force has only a slight influence on the resulting phase composition.
An industrially produced clinker with 1.7 % free lime (determined by wet- chemical analysis) was used. The sample was prepared using a Herzog automatic mill and press (HP-MP) machine with 30, 60 and 90 s milling time and 750, 900, 1100 and 1500 rounds per minute milling speed, the pressing force was 100 kN. Each sample was prepared 3 times.
Measurements were done with the CubiX3 diffractometer (CuKα radiation, 45 kV, 40 mA, X’Celerator line detector). For the quantification, PANalytical’s HighScore Plus and RoboRiet software were used. Amorphous content was determined by the internal standard method. 20 % of rutile (TiO2) was added as standard. Crystallite sizes were also determined using HighScore Plus.

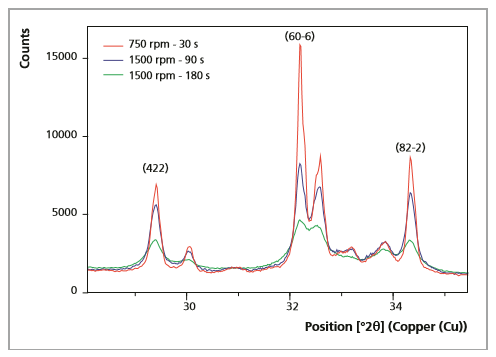
With increasing milling time and speed, a reduction of the absolute intensity and peak area as well as an increase of the full width half maximum (FWHM) can be observed. On the other hand, different peaks of a phase are not all affected in the same way, and the behavior of different phases is not the same either. The strongest effects were observed for alite and free lime. Figure 1 shows the influence on the largest alite peaks. The decrease of intensity and area for the peak indexed als (606) is much larger than for the peaks (422) or (822). This is caused by changes in the preferred orientation and a reduction of the crystallite size.
Figure 1. Influence of sample preparation conditions on the diffraction pattern
Changes in the diffraction patterns influence the quantification results. For routine clinker analyses, only the crystalline components are quantified. Therefore we can observe here relative changes of the amounts of the crystalline clinker phases whereas the amorphous content produced during milling is not taken into account.
Not only alite is affected, but also the other phases. How the phases are influenced depends on their hardness, brittleness and cleavage. Alite is quite hard (Mohs hardness ca. 6), but brittle and shows a good cleavage, and is therefore more affected by the milling than some other compounds. Lime has only a Mohs hardness of 3½ and is one of the weak minerals in clinker. Belite and ferrite as hard phases (Mohs hardness 5-6) and without a distinct cleavage are much more resistant to intense milling conditions. Furthermore, belite is less brittle than alite.
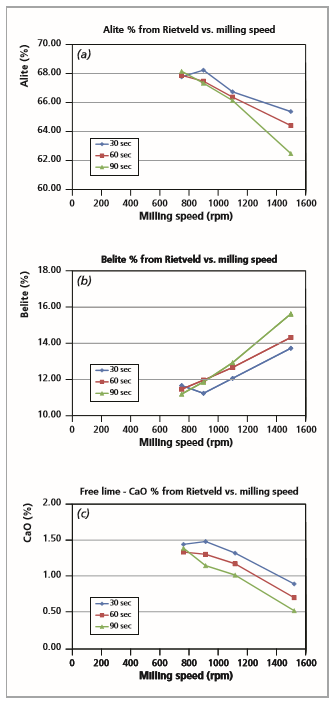
As shown in Figure 2, the influence of the sample preparation on the quantification results is enormous. Concentrations of alite and free lime can be underestimated, while belite concentrations can be overestimated by several percent (absolute).
Figure 2. Influence of milling speed on alite (a), belite (b) and free lime(c) concentrations at different milling times
The real (physical) changes in the material are a reduction of the crystallite sizes and amorphization. These effects are discussed below.
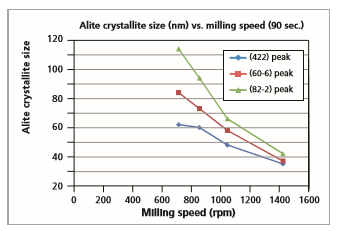
The average crystallite size (not to be confused with particle size) affects the physical properties of cement and may therefore also be a parameter to monitor. The crystallite size is related to the full width half maximum (FWHM) of the peaks. Increasing FWHM caused by intense milling indicates a decrease of the crystallite size. Figure 3 shows the results of the standardless calculations using the Scherrer equation in combination with control measurements with a LaB6 standard. It is obvious that the crystallite size for alite changes significantly.
The crystallite sizes in the various crystallographic directions are different, depending on the shape of the crystallite. During milling, the size converges to a uniform value for all measured directions. After intense milling (1500 rpm, 90 sec) the values for all phases reach a final size of about 30 - 40 nm. For an optimization of milling conditions it is advised to check whether the crystallite sizes in the various crystallographic directions are different from each other. If they are roughly the same, it is an indication that the sample has been overmilled.
Intense milling produces amorphous material. The term 'amorphous' is used here in the sense that it means material with crystallite sizes too small (below ca. 5 nm) to produce clear diffraction peaks. The amorphous content was determined with the internal standard method. With the methodology used the detection limit is around 5 wt%. Table 1 and Figure 4 show the increasing amorphization with harsher milling conditions. With a sample preparation at 750 rpm/ 30 s no measurable amorphous content was detected.
Figure 3. Crystallite size of alite versus milling speed
At higher milling speeds and longer milling times a large change of the phase content occurs. Apart from the changes in the relative amounts of the crystalline compounds, about 30 % of the sample is X-ray amorphous after a preparation at 1500 rpm/90 s. This percentage increases with longer milling times.
Table 1. Amorphous content as a function of milling conditions
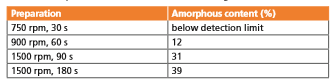
Figure 4. Amorphization during milling
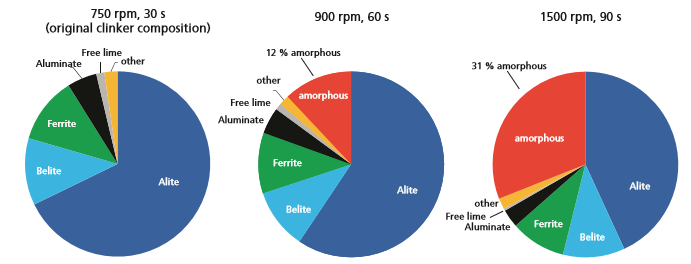
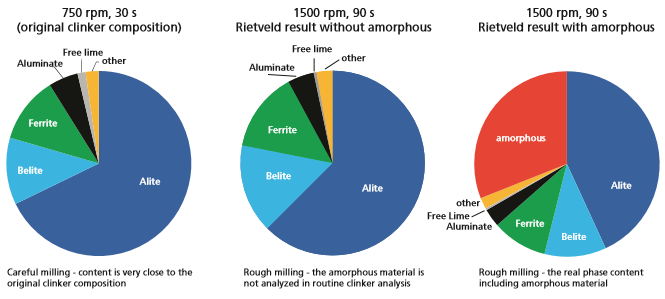
Table 2 and Figure 5 show a comparison between the original phase composition, the Rietveld result assuming only crystalline components and the actual phase content after intense milling. It can be concluded that severe milling conditions significantly affect the Rietveld results by several percent for the different phases. However, when investigating the amorphous content, it is apparent that the real effects on the phase content are even more dramatic. For example alite is reduced by tens of percent.
Table 2. Relative and absolute changes of the material during milling
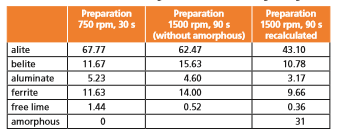
Figure 5. Relative and absolute changes of the material during milling
In this application note we have shown that sample preparation parameters have a large effect on the mineralogy of clinker samples. Wrong preparation of clinker samples renders the minerals to become partially amorphous, which is not accounted for in routine clinker analysis. As a result amorphization due to wrong sample preparation is not seen and the analysis yields wrong conclusions on the mineralogical content of the clinker.
Therefore proper sample preparation conditions are essential for good determination of the clinker mineralogy and reliable process control. Optimal sample preparation depends on many factors such as milling time, speed and equipment. PANalytical’s Expertise program offers specialist’s support for finding the optimal settings for your sample preparation.