
Particle size distributions can change rapidly while granules, aggregates, or flocculated particles disperse in a liquid. Time-resolved laser diffraction captures these changes through a sequence of particle size distribution measurements, providing considerably more information than a single measurement taken before or after dispersion. Interpreting the resulting data, however, can be challenging when several particle populations change at the same time.
This application note examines how Principal Component Analysis (PCA) can be applied to time-resolved laser diffraction data to investigate the dispersion behavior of alumina spray-dried granules. PCA is a multivariate chemometric technique that reduces a complex dataset to a smaller number of principal components while retaining the variation that is most important for interpretation. In particle characterization, this approach can help distinguish changes in individual size populations that may be obscured by conventional summary parameters.
Percentile diameters such as Dv10, Dv50, and Dv90 provide useful summaries of a particle size distribution. Tracking these parameters over time can show whether the overall population is becoming finer or coarser. However, percentile diameters describe the distribution at a macroscopic level. They may provide limited insight into the structural changes responsible for the observed trend, particularly when coarse and fine particle populations are evolving simultaneously.
In the study, particle size measurements were collected every four seconds during ultrasonic dispersion using a Mastersizer 3000+ optical bench with a Hydro MV wet dispersion unit. The conventional parameters showed an overall reduction in particle size, but they did not rapidly reveal the detailed distribution dynamics occurring within the sample.
Applying PCA to the complete distribution profiles enabled the changing particle populations to be analyzed together. The first two principal components accounted for approximately 99% of the cumulative contribution, indicating that most of the observed distribution behavior could be represented using only two components.
Analysis of the loading profiles identified characteristic peaks associated with coarse and fine particle populations. Over the measurement period, the normalized intensities of the coarse populations near 105–135 μm continuously decreased, while the intensity of a finer population near 43 μm increased. The profiles intersected between approximately 180 and 200 seconds, indicating a major transition in the relative contribution of the coarse and fine particle populations.
This pattern is consistent with a size-reduction process in which coarse particles are progressively transformed into finer particles. Potential processes include fragmentation, dispersion, disintegration, or dissolution. PCA does not replace scientific interpretation of the underlying mechanism, but it provides a compact and informative representation of particle population changes that conventional percentile diameters alone may not expose.
The method is relevant to scientists, formulation specialists, process engineers, and quality professionals working with particle systems, including:
The full application note explains the measurement setup, conventional particle size analysis, PCA results, loading-profile interpretation, and temporal changes in the principal particle populations. Register for full access to review the complete methodology, figures, results, conclusions, and supporting references.
Time-resolved data from a laser diffraction particle size analyzer enable characterization of dispersion behavior through changes in particle size distributions. Granulated particles are widely used in the pharmaceutical, food, and chemical industries, where liquid dispersion directly affects product quality, uniformity, and performance [1–4]. Heterogeneous internal structures or multiple domains increase dispersion complexity and may create multiple pathways to the target particle size distribution. In pharmaceuticals, understanding particle release and dispersion is important because particles released from granules must dissolve and exert pharmacological effects [5,6]. Similar phenomena occur in sedimentology, where flocs repeatedly aggregate and disperse; redispersion behavior is essential for evaluating floc strength and sediment stability [7–10].
Conventional distribution descriptors and statistical parameters provide only macroscopic information and limited insight into mechanisms governing distribution changes. Therefore, detailed analysis of distribution structures is valuable. Principal Component Analysis (PCA), a widely used chemometric technique, has been shown to separate and analyze dispersion behaviors associated with structural changes in particle size distributions [11]. This application note applies PCA to time-resolved particle size distribution data to investigate evolving distribution behavior and evaluate the usefulness of this approach.
The sample used in this study was an alumina spray-dried granulate provided by Preci.Co., Ltd., a collaborative research partner. For peak separation and chemometric analysis, the software VEKTOR (KAX Group), provided by Quality Design Inc., was employed.
Particle size measurements were conducted using a Mastersizer 3000+ optical bench equipped with a Hydro MV wet dispersion unit. Prior to analysis, the 130 mL dispersion medium in the Hydro MV unit was replaced with Milli-Q water and maintained under circulation. A fixed amount of sample was then introduced into the system. Sample addition was automatically detected using a scattering-intensity trigger, after which the measurement sequence proceeded with ultrasonic dispersion during analysis. Data were collected at 4-second intervals, and a total of 100 consecutive measurements were performed.
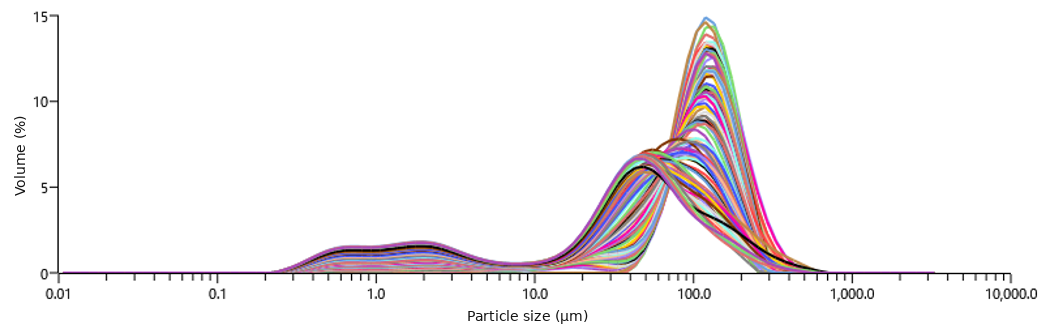
The resulting particle size distribution profiles revealed complex dispersion behavior (Fig.1).
To further investigate this behavior, conventional percentile diameters, namely Dv10, Dv50, and Dv90, were monitored as a function of time. The results indicated a macroscopic decrease in overall particle size throughout the dispersion process (Fig.2).
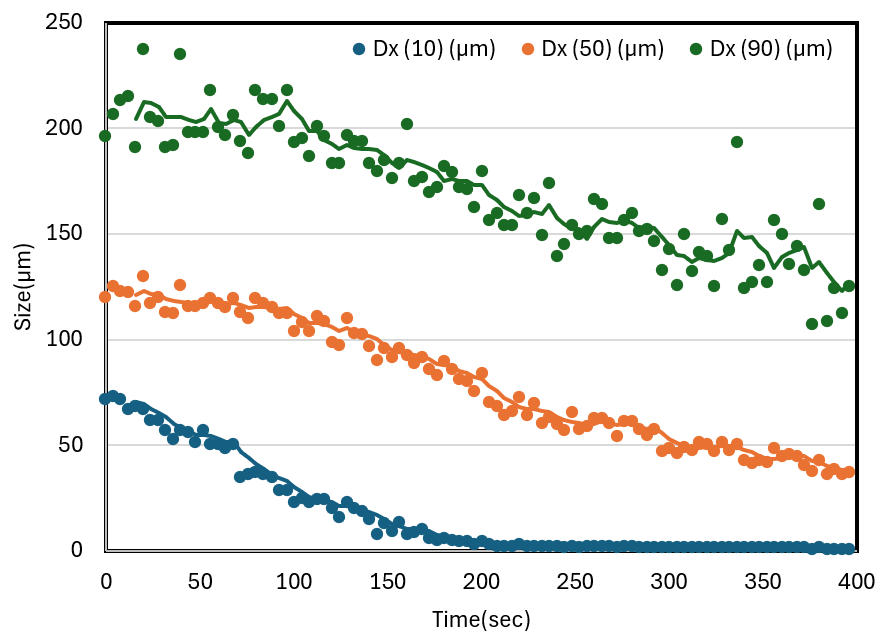
More detailed examination revealed that Dv10 rapidly converged to a stable value, whereas Dv50 exhibited a more gradual change. However, the early decrease observed in Dv10 was strongly correlated with the overall particle size reduction and provided limited additional information beyond the fact that particle size decreased over time. Consequently, these conventional indicators alone were insufficient for rapidly extracting meaningful information regarding the actual distribution dynamics occurring within the system.
To gain further insight into the underlying dispersion behavior, PCA was applied to separate and analyze the distribution profiles (Fig. 3).
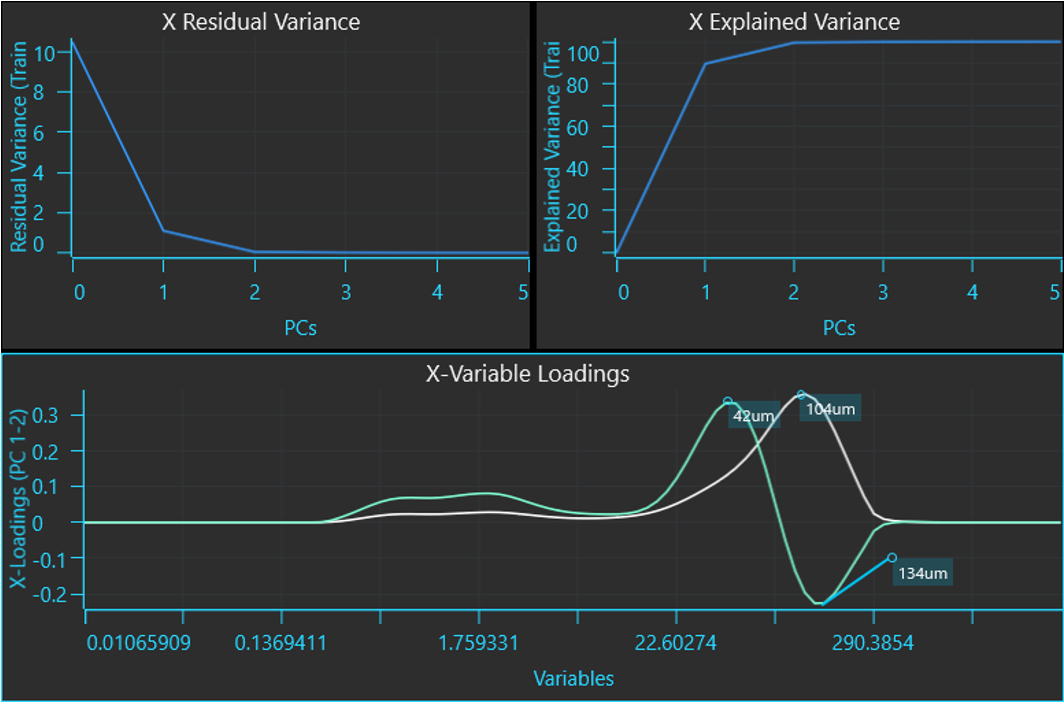
The PCA scree plot indicated that the cumulative contribution of the first and second principal components reached approximately 99%. Therefore, only the first two principal components were retained for subsequent analysis. Furthermore, interpretation of the score plot demonstrated that the observed complex distribution behavior could be explained almost entirely by these two principal components.
Analysis of the loading profiles identified three characteristic particle size peaks at approximately 135, 104, and 45 μm, which were defined as the principal peaks associated with the observed changes.
The normalized size-frequency intensities of these three particle size peaks were then examined as a function of time (0–300 s) in Fig.4.
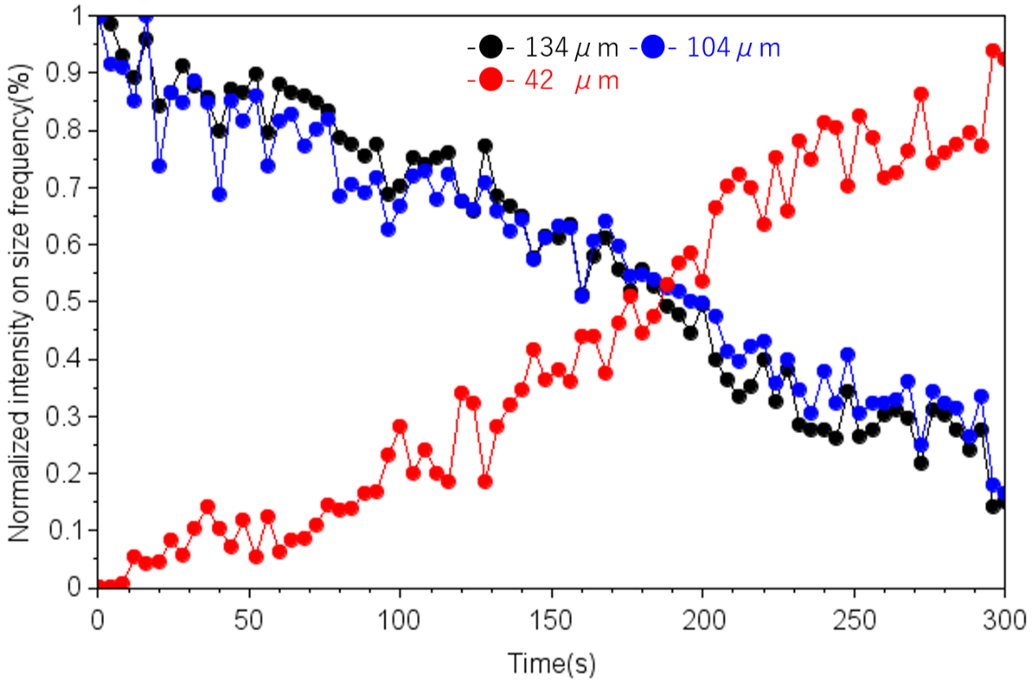
Immediately after the start of measurement, the normalized intensities corresponding to 134 μm (black line) and 104 μm (blue line) were close to their maximum values (~1.0). Both intensities then decreased continuously over time, reaching approximately 0.1–0.2 after 300 s. In contrast, the normalized intensity associated with 42 μm (red line) increased gradually from nearly zero at the initial state and reached approximately 0.9 near 300 s.
The normalized intensity profiles of all three components intersected at approximately 0.5 between 180 and 200 s. This dynamic transition suggests that a size-reduction process, such as fragmentation, dispersion, disintegration, or dissolution, was occurring within the system, whereby coarse particles (~105–135 μm) were progressively transformed into finer particles (~43 μm). These findings further demonstrate the effectiveness of multivariate analysis for data compression while preserving essential information regarding particle transformation processes.
The results presented in this application note demonstrate that PCA is an effective analytical tool for efficiently compressing information contained in time-resolved particle size distribution data while simultaneously extracting changes in the key particle populations involved in dispersion processes. This approach has considerable potential for application in a wide range of particle-related fields, including the evaluation of pharmaceutical granule disintegration and dispersion, quality assessment of spray-dried granules, and analysis of the redispersion behavior of aggregates and flocculated particles.
In particular, when applied to real-time particle size distribution data, PCA is expected to facilitate the elucidation of dispersion mechanisms and structural transformations that cannot readily be identified using conventional particle size metrics alone. Consequently, the method represents a valuable approach for improving the understanding and optimization of particle processes across diverse industrial and scientific applications.
This work was conducted as a collaborative research project with the following organizations, whose contributions are gratefully acknowledged: