Polystyrene (PS) and poly(methyl methacrylate) (PMMA) are two of the most widely used synthetic polymers. Polystyrene is used as a protective packaging for anything from foods to cd cases and disposable cutlery, while PMMA is regularly used as a polymeric alternative to glass and even in some medical technologies, and countless other consumer products.
In both cases, melting and molding are regular processes that these polymers must endure. It is therefore important to understand how they will respond to this kind of treatment. It is well recognized that the bulk properties of a polymer such as strength, toughness, flexibility, etc. are strongly dependent on molecular properties such as molecular weight and branching. If the molecular properties of these polymers change as a consequence of the processing, then it is likely that the final properties of the molded product will vary from those expected of the virgin polymer.
A study was therefore undertaken to explore how these polymers respond to the stresses of molding. This application note describes the molecular and rheological changes that occurred as samples of PS and PMMA were repeatedly extruded through a capillary rheometer, simulating moulding. The capillary rheometer was used to measure changes in melt viscosity, while multi-detector GPC was used to characterize changes in molecular weight and structure in the samples after each cycle through the rheometer.
Polystyrene (PS) and poly(methyl methacrylate) (PMMA) are two of the most widely used synthetic polymers. Polystyrene is used as a protective packaging for anything from foods to cd cases and disposable cutlery, while PMMA is regularly used as a polymeric alternative to glass and even in some medical technologies, and countless other consumer products.
In both cases, melting and molding are regular processes that these polymers must endure. It is therefore important to understand how they will respond to this kind of treatment. It is well recognized that the bulk properties of a polymer such as strength, toughness, flexibility, etc. are strongly dependent on molecular properties such as molecular weight and branching. If the molecular properties of these polymers change as a consequence of the processing, then it is likely that the final properties of the molded product will vary from those expected of the virgin polymer.
A study was therefore undertaken to explore how these polymers respond to the stresses of molding. This application note describes the molecular and rheological changes that occurred as samples of PS and PMMA were repeatedly extruded through a capillary rheometer, simulating molding. The capillary rheometer was used to measure changes in melt viscosity, while multi-detector GPC was used to characterize changes in molecular weight and structure in the samples after each cycle through the rheometer.
One sample of PS and one of PMMA were extruded through the Malvern RH10 capillary rheometer. The PS sample was run at 200 C and the PMMA sample was run at 230 C. Both samples were run through a shear rate table from 20 to 2000 s-1 for each extrusion process. Each sample was collected and this material was again extruded through the rheometer a total of four times. Thus, for each polymer, five samples were collected of virgin polymer and material which had been processed for up to four cycles through the rheometer.
These samples were dissolved in THF to concentrations of 2 – 5 mg/ml. Samples were separated through two Malvern T6000M mixed bed SVB columns and analyzed using a Malvern OMNISEC system including refractive index (RI), UV-Vis, low-angle light scattering (LALS), and viscometer (IV) detectors.
Figure 1 shows the GPC results for the PS sample on the three detectors. Each line is an overlay of four duplicate injections of each sample. A clear trend is visible on all detectors with the sample peak eluting slightly later in the chromatogram and giving smaller responses on the LALS and IV chromatograms. The results indicate sample degradation with each cycle through the rheometer and this bears out in the analyzed results in Table 1 which shows a steady decrease in molecular weight and intrinsic viscosity as the cycles progress.

Figure 1: Chromatograms of PS showing RI (top), LALS (middle), and IV (bottom) detector responses for each processing cycle.
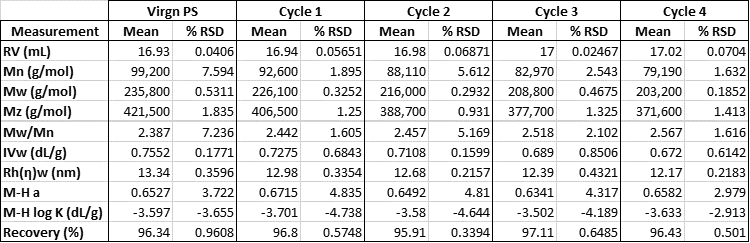
Table 1: Molecular results for PS at each processing cycle.
In contrast, the PMMA shows a very different trend during the same measurements. As can be seen in Figure 2, the PMMA sample shows a significant peak shape change in its chromatograms. This is noticeable to different extents in all the detectors.
As can be seen in Table 2, this change represents a significant increase in molecular weight. In particular, Mz is increasing dramatically indicating a growing amount of very high molecular weight material.
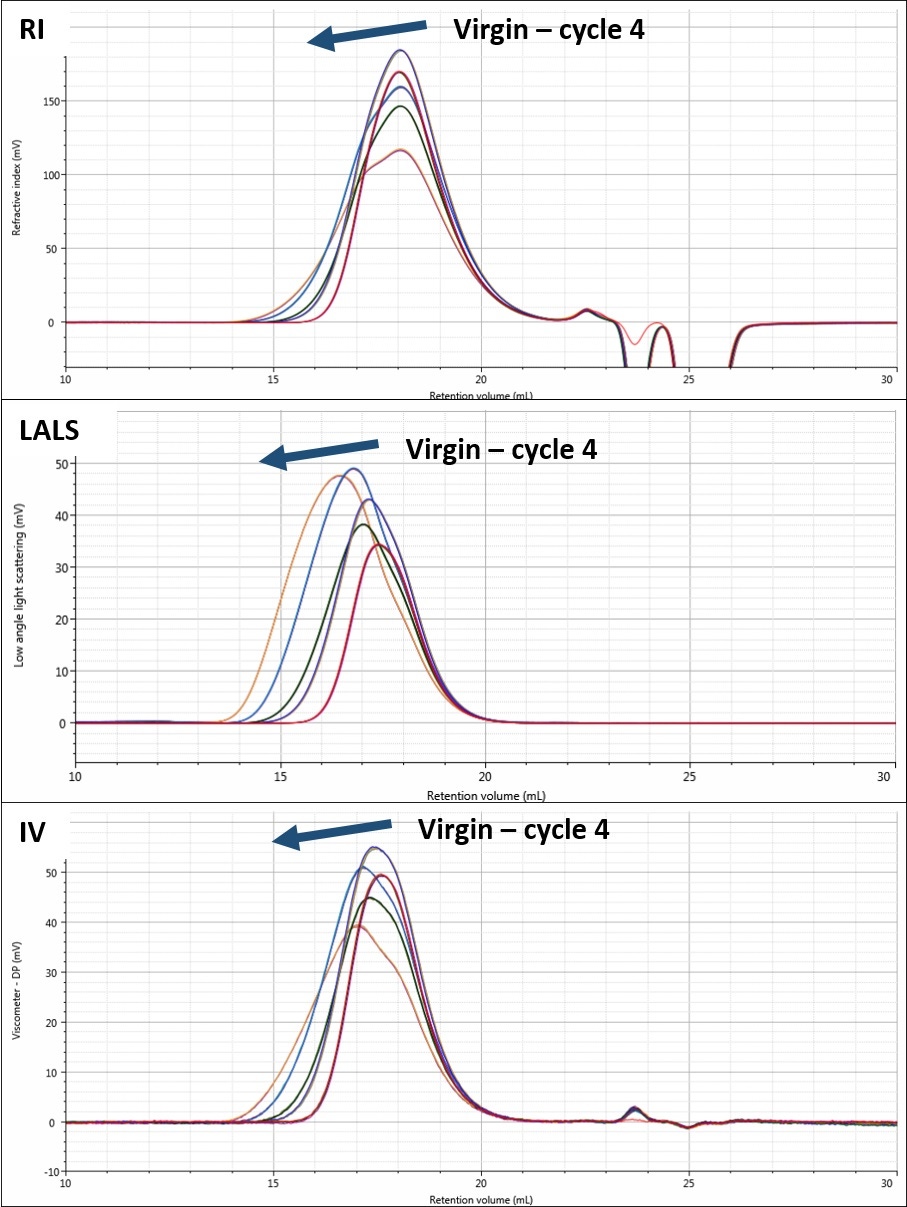
Figure 2: Chromatograms of PMMA showing RI (top), LALS (middle), and IV (bottom) detector responses for each processing cycle.
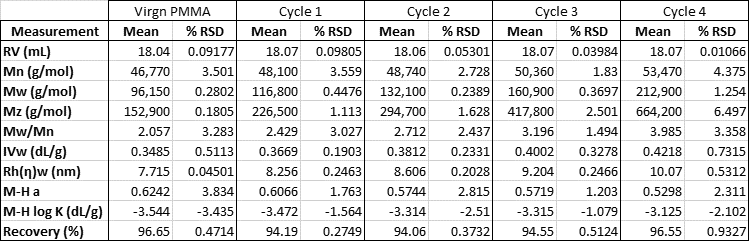
Table 2: Molecular results for PMMA at each processing cycle.
Figure 3 shows the changes in molecular weights and the differences in behavior between the two samples. The PS shows a decrease of approximately 5% in Mn, Mw, and Mz with every cycle through the rheometer. In contrast, the PMMA shows a small increase in Mn, and Mw, but a much more dramatic, almost exponential, increase in Mz.
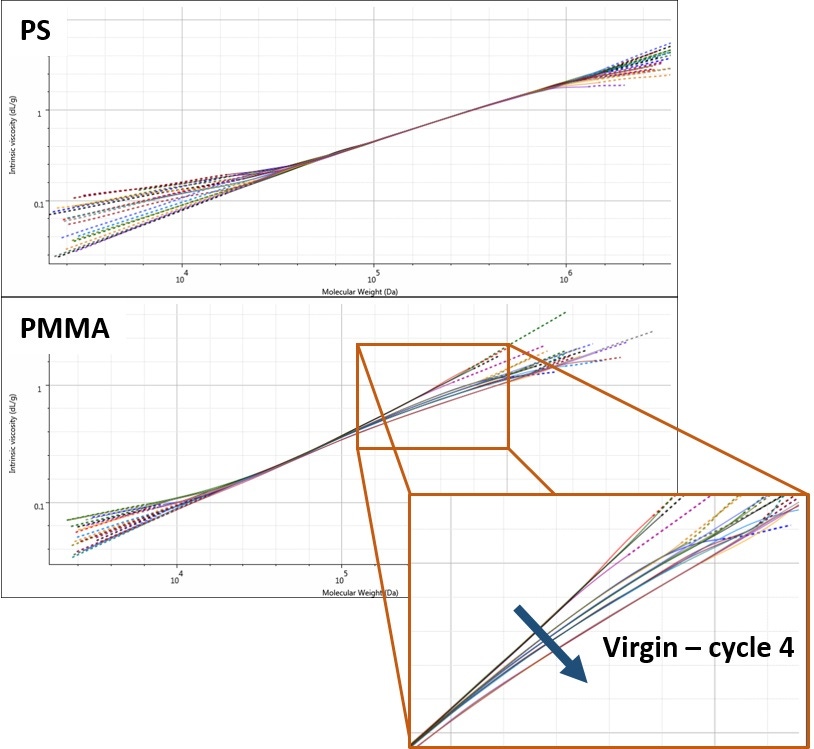
Figure 3: Trends in molecular weight moments for PS (left) and PMMA (right) at each processing cycle.
The explanation for the differences in behaviors for the two polymers is found in the Mark-Houwink plots. A Mark-Houwink plot allows the comparison of molecular structure of different polymer samples. It is commonly used to assess branching and any other structural changes.
The Mark-Houwink plot for PS (Figure 4; top) shows that all of the PS measurements overlay with each other. This indicates that all of the samples have the same structure, despite the observed differences in molecular weight. The conclusion from this is that during molding the polymer is undergoing simple degradation through polymer chain scission.
On the other hand, the PMMA Mark-Houwink plots do not overlap with each other (Figure 4; bottom). At higher molecular weights, these plots diverge, with each cycle through the rheometer generating increased curvature in this high molecular weight region. Such curvature typically indicates long-chain branching. In this case, though, it suggests that the likely explanation for the increasing molecular weight in the PMMA sample is cross-linking. As samples are passing through the rheometer, polymer chains are cross-linking to form higher molecular weight branched molecules. This conclusion fits with the increasing molecular weight and the changing structure observed in the Mark-Houwink plot.
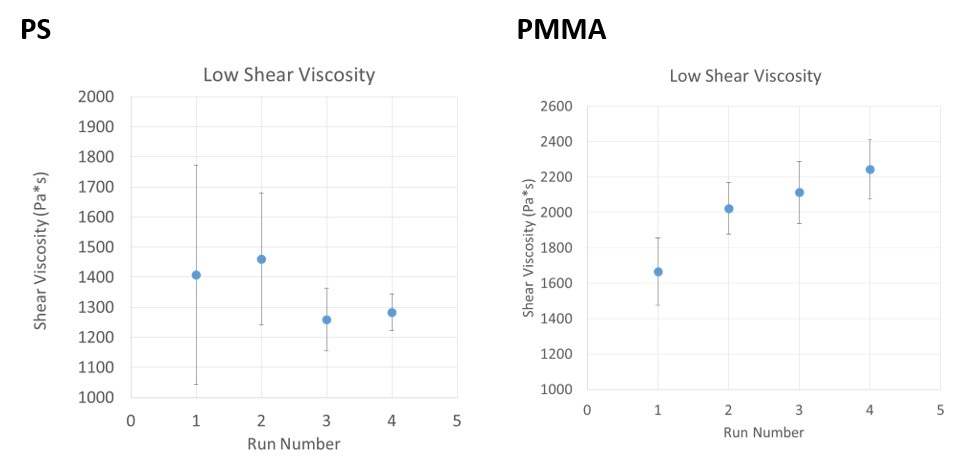
Figure 4: Mark-Houwink plots for PS (top) and PMMA (bottom) at each processing cycle.
Looking finally at the data from the rheometer, it appears that the small differences in molecular weight are not significantly affecting the melt viscosity of the PS sample at 20 s-1 (Figure 5; left). However, a slight trend can be seen in the melt viscosity of the PMMA samples (Figure 5; right) at that shear rate. With each cycle through the rheometer, the melt viscosity of the PMMA sample appears to increase slightly, concurrently with the increasing molecular weight. This shear rate was chosen for comparison because zero-shear viscosity is strongly correlated with the molecular weight of the sample and 20 s-1 is the lowest measured shear rate for this experiment.
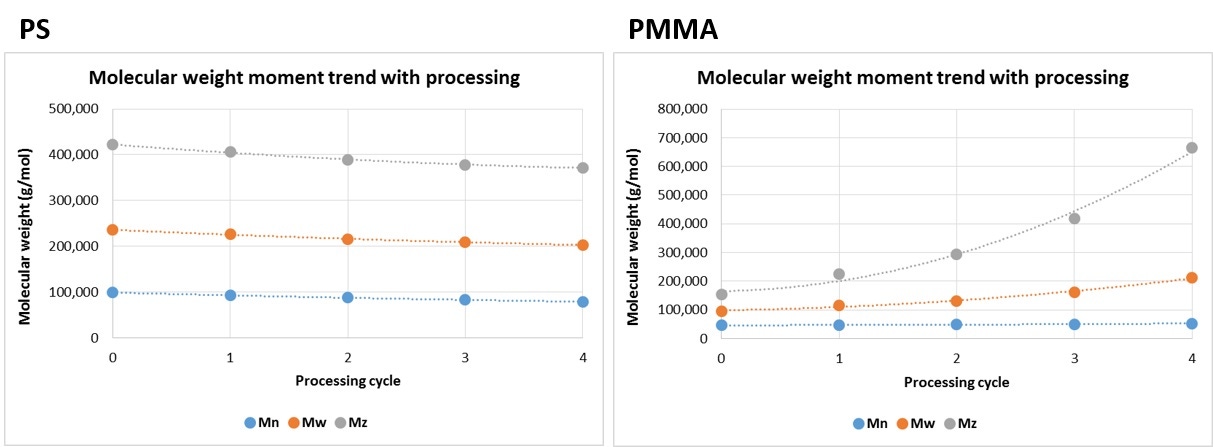
Figure 5: Melt viscosity at 20 s-1 for PS (left) and PMMA (right) at each processing cycle.
The results presented in this application note demonstrate both utility of using multiple polymer characterization tools to characterize polymer properties, and how different polymers respond quite differently to the same treatment.
The PS sample showed the kind of polymer degradation that might typically be expected as a polymer endures the molding process. It was observed that its molecular weight decreased in a reasonably steady manner with each cycle through the rheometer. Its structure was unaffected. Although these changes were too small to manifest in the rheometer measurements, it is clear that these changes would slowly change the performance characteristics of the molded part being produced, in this case, likely weakening the final product.
On the other hand, the PMMA showed quite different behavior. Unlike the PS, the PMMA molecular weight actually increased during the molded which was likely caused by cross-linking of the polymer chains. The effect of this was a slight increase in melt viscosity. This could cause a moulded part to be out of specification due to increased resistance to molding pressures, for example.
The use of two technologies here allowed the investigation of these polymers at two levels. While the multi-detector SEC measurements showed the underlying changes occurring in the two polymer samples, the rheology measurements showed how those changes were affecting the bulk properties of the material. Using these types of measurements, producers of polymer products can more clearly understand how their polymers are changing during molding. For example, both the degradation and the crosslinking observed in the two polymer samples will limit how many times waste material can be re-used. With this information, producers can save money on waste material and improve quality by reducing the incidence of part failure. In both cases, this will lead to improved efficiency and a more profitable bottom-line.