Measurement and characterization of binding interactions between proteins and low-molecular weight (LMW) ligands are a focus of academic research and drug discovery. Isothermal titration calorimetry (ITC) directly measures heat released or absorbed in a binding event, providing means for studying protein-small molecule interactions in solution without the need for labeling or immobilization. Importantly, ITC is often utilized to characterize differences in entropic and enthalpic contributions to binding of novel ligands.
Measurement and characterization of binding interactions between proteins and low-molecular weight (LMW) ligands are a focus of academic research and drug discovery. Isothermal titration calorimetry (ITC) directly measures heat released or absorbed in a binding event, providing means for studying protein-small molecule interactions in solution without the need for labeling or immobilization. Importantly, ITC is often utilized to characterize differences in entropic and enthalpic contributions to binding of novel ligands.
One of the challenges associated with the measurement and characterization of binding interactions is the broad affinity range that needs to be addressed. Binding affinity values (measured as the dissociation equilibrium constant, KD) of small compounds binding to a target protein in a typical drug discovery project can span from low millimolar to subnanomolar range. Dependent on the biochemical system under study (receptor, transporter, enzyme, etc.), an equally broad affinity range is relevant for academic research.
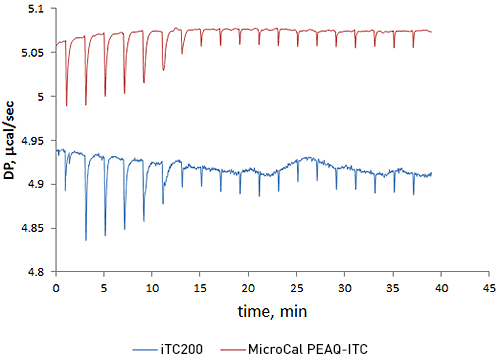
Highly sensitive ITC instruments and properly designed experiments greatly simplify characterization of binding interactions. Our new ITC system, MicroCal PEAQ-ITC, is designed to improve signal stability, mixing, and signal-to-noise characteristics (Fig 1). These changes, along with an advanced experimental design feature integrated in the easy-to-use data analysis software, facilitate optimization of experiments for the studies of challenging interactions. This white paper highlights the beneficial features of the new MicroCal PEAQ-ITC instrument and software for the analysis of binding interactions through direct and competitive titrations.
A titration of acetazolamide with bovine carbonic anhydrase II was performed to compare the new MicroCal PEAQ-ITC, with its predecessor, MicroCal iTC200. The data from two sets of experiments shows that MicroCal PEAQ-ITC has about 5 times lower short term noise (Fig 1). These improvements in data quality increase confidence when analyzing challenging data with low heats when sample is precious or low concentrations are required to accurately quantitate low-nanomolar affinity interactions.
|
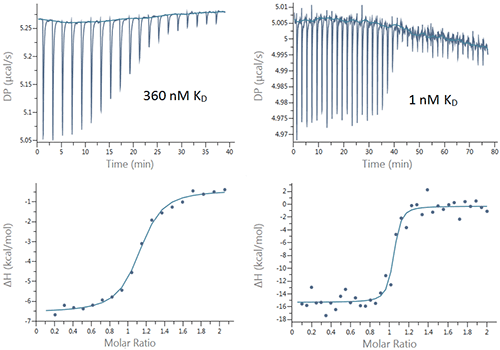
Here we demonstrate the applicability of the new PEAQ MicroCal ITC instrument for characterization of binding interactions by performing titrations of bovine carbonic anhydrase II (bCAII) and human carbonic anhydrase I (hCAI) with a number of inhibitors. These examples cover a broad range of KDs (0. 320 mM to ~ 1 nM) and enthalpies (~-6 to ~-15 kcals/mol) . Typical data sets are shown in figure 2 and the results are summarized in Table 1.
|
| Protein | cmpd, n=3 | N (sites) | error (N), % | KD (M) | pKD | error (KD), % | ΔH (kcal/ mole) | error (ΔH), % |
|---|---|---|---|---|---|---|---|---|
| hCAI | Sulfanil-
amide |
1.0 | fixed | 3.2E-04 | 3.5 | 16 | -5.9 | 15 |
| Ethoxzol-
amide |
1.0 | 1.0 | 1.9E-08 | 7.7 | 7 | -8.7 | 1 | |
| bCAII | Furosemide | 1.0 | 1.7 | 3.6E-07 | 6.4 | 18 | -6.3 | 3 |
| Acetazol-
amide |
0.9 | 0.6 | 1.8E-08 | 7.7 | 3 | -12.6 | 3 | |
| Ethoxzol-
amide |
0.9 | 0.3 | 4.4E-10 | 9.4 | 95 | -14.4 | 3 | |
| Ethoxzol-
amide Vinj=1 uL |
1.0 | 1.0 | 1.3E-09 | 8.8 | 76 | -15.1 | 1 |
All the interactions were studied using a standard protocol of injecting 18, 2 µL aliquots of ligand into the protein solution in the cell. For the interactions with affinities of 18 nM and weaker, the errors in the KD were all less than 20 %, with some well below 10 %. The errors in the enthalpy and stoichiometry data were also all under 3 % except for the sulfanilamide: hCAI interaction where the N was fixed and the enthalpies varied by 15 %. These measurements show the highly reproducible data that can be achieved using this instrument even with concentrations of protein as low as 2.5 micromolar.
Predictably, the ethoxzolamide, the tightest binder, showed the highest variation of KD value in triplicate experiments (Table 1) due to relatively high C-value* and less well-defined transition range represented by only two experimental data points on the binding isotherm. Even so, the error of 94% is often acceptable for these tight interactions and affords a certain amount of confidence in the data.
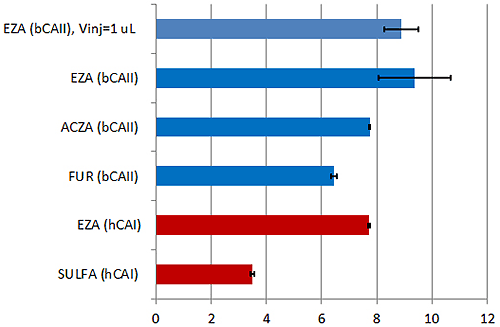
However, because of the low signal to noise and good precision of the pipette of the new MicroCal PEAQ-ITC instrument (Fig 1), smaller, 1 µl, injection volumes could be employed. Using this approach it is possible to populate the transition region (figure 2) with more data points increasing the quality of the affinity data. This was demonstrated in the small but measurable decrease in the error in the KD to 76% increasing confidence in the data even further. Figure 3 shows these data in terms of pKD which is perhaps are more appropriate way for comparing affinity data.
| * C-Value is defined as C = N*[Cell]/KD, where [Cell] is molar concentration of macromolecule in the cell, KD is the equilibrium dissociation constant, and N denotes the number of binding sites on the macromolecule. |
|
It is clear from the data already shown in this white paper that errors in KD determination increase as the affinities become tighter. A competition titration can be employed in such cases.
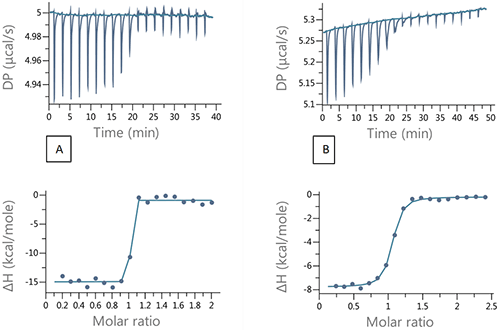
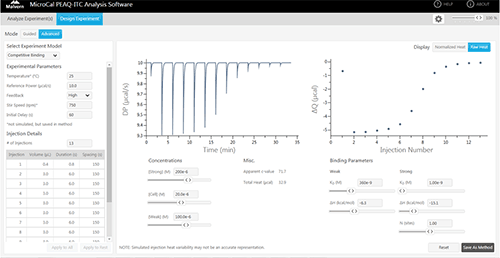
In a competition experiment, the strong binding ligand is injected into the target protein in the presence of a weaker, competitive compound. In the absence of the weaker inhibitor the ITC titration does not have the sufficient number of data points in the transition region required for fitting to a unique binding isotherm. An example of this is shown in figure 4A, where 200 µM ethoxzolamide was injected in to 20 µM bCAII in 2 µL aliquots. By using the competition experiment design tool provided with the MicroCal PEAQ-ITC (see figure 5), it was possible to identify experimental conditions that would ensure an sufficient number of data points in the transition range and at high enough heat value for good signal to noise. A set up with 100 µM furosemide added to the protein solution was selected. The resulting titration is shown in figure 4B.
|
|
| Experimental setup | KD (nM) | error(KD), % | ΔH (kcal/mol) | error(DH), % |
|---|---|---|---|---|
| Direct titration | 0.4 | 95 | -14.4 | 3 |
| Competition titration | 0.4 | 40 | -13.9 | 6 |
The binding parameters for the tight binder derived from the competition titration agreed very well with the data from direct titration (Table 2). This case study demonstrates the utility of the competition experiments and the design tool for determination of tight binding interactions.
The results here show the quality of the data that can be achieved with the new Microcal PEAQ-ITC system. It has a high signal-to-noise ratio and can be used to measure a broad affinity range. The tightest example measured here, namely the interaction between EZA and bCAII, has an affinity of 1 nM with only two-fold variability. This is of exceptional repeatability for any technique measuring nanomolar affinities. The micromolar interactions measured here had errors of only approximately 20% or better. These represent excellent repeatability for the determination of KD.
Competition experiments, where the protein is premixed with one ligand and titrated with another, can be used to extend the affinity range that ITC can be used for into the high picomolar range. One drawback with that approach has been the complexity of the experimental design. The MicroCal PEAQ-ITC Analysis Software has a simulation tool making the design and analysis very straightforward.
In addition to the improvement in the signal-to-noise ratio, MicroCal PEAQ-ITC system has completely automated data analysis, minimizing analysis time and user subjectivity in assessing data quality. Data quality is determined and fitting performed in a few seconds per experiment allowing for analysis of large data sets of 50 or more experiments in a matter of seconds.