
Multiple detectors were used to characterize the protein-detergent complex (PDC) formed during the purification of a membrane protein in the presence of a detergent. The MW and composition of the PDC and of the free micelles were measured. Data are shown for a purified membrane protein and a bacterial membrane protein involved in multidrug resistance.
Size-exclusion chromatography (SEC) is a tool that is commonly used in the biological sciences. Typically, it is used to measure the molecular weight of an unknown sample by referencing the elution time of the unknown against that of standards of known molecular weight. This can be done with a single concentration detector such as UV or refractive index (RI). Advanced multi-detector SEC systems now include up to four detectors including UV, RI, light scattering and intrinsic viscosity. Light scattering detectors allow the measurement of molecular weight without the need for column calibration. Intrinsic viscosity is a measure of molecular density and enables structural changes to be assessed. A combination of light scattering and intrinsic viscosity allows size (Rh) to be calculated.
Maintaining the detectors in series is essential for maintaining maximum sensitivity across all four detectors.
Studies of membrane proteins are becoming increasingly frequent in molecular biology research. Crystallization is one of the main goals of this research in order to characterize the structure of a protein; however, crystallization of these proteins has proven difficult. Crystallization of a membrane protein will depend on many factors such as protein purity and the detergent concentration or type. Removal of too much of the detergent component of a membrane protein complex can lead to degradation of the protein and reduce the likelihood of crystallization. Characterizing and optimizing the proportion of protein and detergent in a purified membrane protein sample can provide valuable insight into the likelihood of crystallization and the protein content of the protein detergent complex (PDC).
In this application note a purified membrane protein and a bacterial membrane protein involved in multidrug resistance, is characterized using the Viscotek TDAmax system, a complete size-exclusion chromatography system with refractive index (RI), ultraviolet (UV), light scattering (LS) and intrinsic viscosity (IV) detectors.
The sample was purified in the presence of the detergent n-dodecyl β-D-maltoside (DDM). The mobile phase was PBS supplemented with 0.02% w/v DDM and the sample was separated on a GE Superdex 200 SEC column.
The analysis used was the OmniSEC co-polymer analysis which uses the dn/dc and the dA/dc (extinction coefficient) of both the protein and the detergent to calculate the concentration and then the molecular weight of both components at each data slice along the chromatogram. A value of 0.185 ml/g was used for the dn/dc of the protein. Its extinction coefficient was estimated to be 0.5 (A280; 1 mg/ml). Previous work has shown the dn/dc of DDM to be 0.1608 ml/g and its extinction coefficient was measured to be 0.0044 (A280; 1mg/ml).
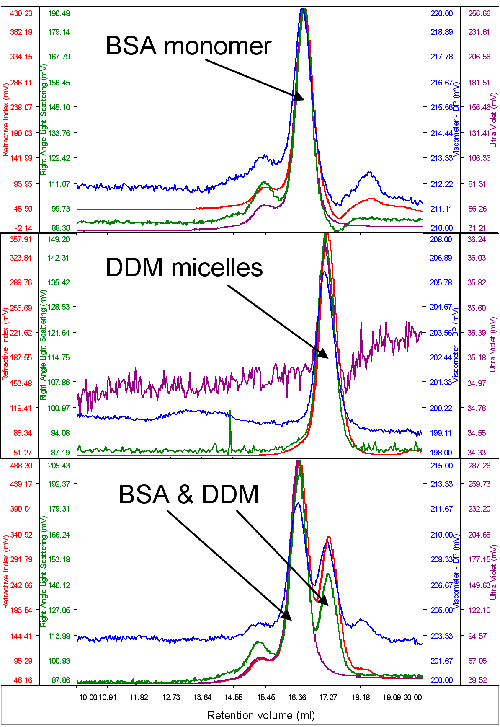
Typically, only a very small amount of purified protein is available for analysis. As such, protein and detergent micelle behavior on the system were studied with a typical standard protein, bovine serum albumin (BSA). The molecular weight of this protein was used to calibrate the detector responses of the instrument. An excess of pure DDM micelles was then run to measure their molecular weight and size. Figure 1 shows chromatograms of BSA, DDM and the two together.
|
It is clear, firstly, that the two samples elute at different volumes giving reasonable resolution between the two. The second immediately visible feature is that while BSA shows significant absorption on the UV channel (280 nm) the signal from the DDM is very low. This is clear from the chromatograms when the two samples were run alone and when the two samples are run together.
The molecular weight of the BSA was correctly measured to be 67 kDa. The DDM micelles had a measured molecular weight of 60 kDa and a size of 2.5 nm when measured alone. A slight increase in DDM molecular weight (65 kDa) was observed when the BSA and DDM were measured together and this is believed to be due to the limited resolution between the two peaks.
Once the BSA and DDM had been shown to run well on the system, the membrane protein was injected. The concentration was 0.5 mg/ml protein and 100 μl was loaded.
The sample eluted in one peak with a shoulder on the ascending edge according to the RI. This shoulder was associated with the majority of the UV signal identifying it as the protein detergent complex (PDC), whereas the main body of the peak had very little UV signal, suggesting that this was the DDM micelles (Figure 2).

|
The region of the peak without UV absorbance had a measured molecular weight of 62.5 kDa and a size (RRh using intrinsic viscosity) of 2.6 nm clearly identifying it as the DDM micelles.
The shoulder and UV peak had a molecular weight of 74.5 kDa and was identified as the PDC. Analyzing the conjugate, the proportion of PDC in the overall sample was calculated to be 21.6% whereas the free DDM micelles comprised 78.4% of the sample. The PDC was calculated to contain 46% protein and 54% DDM.
The molecular weight of the protein was known to be 33 kDa. This is 44% of the molecular weight of the PDC and is very close to the calculation that the protein comprised 46% of the PDC and provides excellent corroboration for the results obtained.
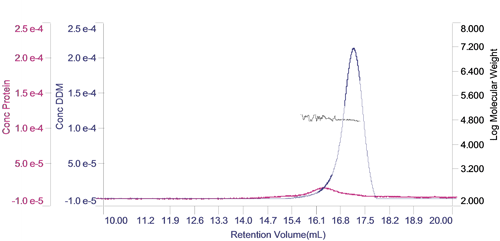
The concentration of each of the two components can be calculated and plotted in a derived chromatogram showing component concentration as opposed to detector responses (figure 3). This provides an excellent visual representation of the composition of the sample. In this case, it is clear that the concentration of the protein is significantly lower than that of the DDM micelles. Furthermore, it is clear that the vast majority of the DDM is in free micelles and not in the PDC. The molecular weight of the two peaks has also been plotted on the derived chromatogram.
|
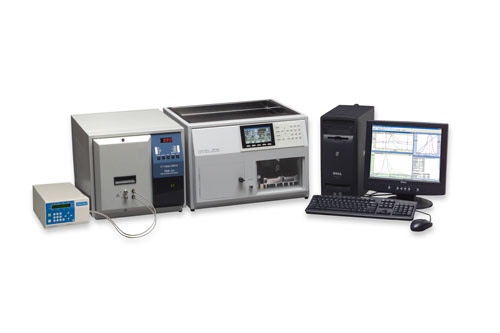
The Viscotek TDAmax system (figure 4) was used here to characterize the protein detergent complex formed during the purification of bacterial multidrug membrane protein in the presence of the detergent DDM. The molecular weight of the PDC and of the free DDM micelles was measured. Furthermore, the composition of the PDC, in terms of protein and DDM content was measured and found to be very close to expectations.
|