The calculation of size distributions using laser diffraction requires users to specify the optical properties of the sample being analysed. This technical note provides guidance as to how the particle absortpion, or imaginary RI, can be determined.
Laser diffraction instruments obtain particle size information by measuring the angular dependence of the intensity of light scattered by particles illuminated in a laser beam. An optical model is then used to interpret this scattering data and hence calculate a particle size distribution. The scattering model that is generally used is Mie theory. This is the scattering model that is recommended by the international standard for laser diffraction (ISO13320-1), especially when particles smaller than 50 μm in size are being measured.
Mie theory is a general solution of Maxwell's equations for the interaction of light with matter. When applied to laser diffraction measurements, it predicts both the intensity of light scattered from the particle surface, as well as the behavior of light which is transmitted and refracted through the particle, as illustrated in Figure 1. In order to use this theory correctly, the complex refractive index for the material being measured is required. This complex refractive index comprises a real and imaginary part. The real part of the refractive index is required to predict the diffraction from the particle surface and can be determined from refractometer measurements, microscope observations or can be estimated using empirical methods [2,3]. The imaginary refractive index accounts for the attenuation of light as it passes through the particle, and is commonly referred to as the absorption of the material. This application note will look in more detail at the absorption and how the correct absorption value can be determined for a sample.

|
The absorption of a material is dependent on its molecular makeup, and whether there are any chromophores present within the molecular structure which cause light to be absorbed at a wavelength of the light source used in the laser diffraction measurements. Pigments are good examples of materials that contain strong chromophores, as it is the absorption of light at specific wavelengths which gives rise to their color. Typically, laser diffraction systems combine measurements made at red (600-700nm) and blue (400-500nm) wavelengths. If a material contains a chromophore that causes light to be absorbed within the wavelength ranges, the absorption used in the Mie Model will need to be high (>0.1).
Although the molecular properties of the material are important in defining the absorption used in the laser diffraction analysis, ISO13320-1 highlights the fact that the physical nature of the particles also needs to be considered. In particular, if the particles have a rough surface structure, or have a complex internal structure, the absorption will be higher than that predicted based on spectroscopic analysis of the material. For this reason, spectroscopic measurement of the material's absorption often does not yield the correct absorption value for use in laser diffraction analysis.
For the purposes of a laser diffraction measurement, the absorption of a material generally only has to be specified to an accuracy of an order of magnitude, for example, 1 or 0.1. If it is possible to look at the particles under a microscope, then their appearance can often be used to estimate a value for the absorption, as shown in Table 1.
Table 1: Appearance of particles
Appearance | Imaginary RI | Example |

| 0
| Latices
|
Another method which can be used to determine the absorption of a sample relies on the laser diffraction measurement itself. One of the parameters calculated by the Mastersizer analysis is the volume concentration (Cv) of particles being measured. This is calculated based on the measurement of laser light obscuration, using Beer-Lambert's law.
Beer-Lambert's law describes the relationship between the absorption of light passing through a material and the properties of that material. It states that the intensity of light transmitted through a material is dependent on the material's absorption coefficient and the distance which the light travels through the material. The absorption coefficient itself is dependent on the wavelength of light and the imaginary part of the refractive index. It is this dependence which will allow us to use the Mastersizer's measurement of the volume concentration to determine the correct value of the imaginary refractive index.
In this application note the absorption of a calcium carbonate sample will be determined.
In order to obtain a first estimate of the absorption, the sample was dispersed in water and then observed under a microscope (Figure 2). The images show that the particles appear transparent but are not spherical and have some surface roughness. Therefore, relating back to Table 1, this would suggest that the absorption is between 0.1 and 0.01.

|
This estimate of the value of the absorption can be tested by measuring a known concentration of the sample and comparing this known value to the value calculated by the Mastersizer analysis. Three different masses of calcium carbonate, 6.1mg, 13.3mg, 20.7mg, were therefore added to the known volume of liquid in the Mastersizer's dispersion unit in order to make up the three known suspension concentrations. The scattering data collected for each suspension were then analyzed using a range of values for the absorption. The refractive index used for calcium carbonate was 1.57 [1] and the values of absorption used were 1, 0.1, 0.01 and 0.01. The particle size distributions calculated using these values are shown in Figure 3.
From these analyses the calculated percentage volume concentration can be plotted against the known volume concentration for each value of the absorption. A linear fit is then applied to each data set. The gradient of the linear fit can then be used to determine which value for the absorption gives the most direct relationship between the real and calculated concentration (the gradient closest to 1). In this case a good agreement occurs using absorption values of 0.01 and 0.1.
It is possible to refine the selection of the absorption by looking at how well the Mie Model predicts the scattering data collected by the Mastersizer system when using different absorption values.
In order to interpret the scattering data from a sample to give particle size information, the Mie scattering model is used. Unfortunately, this model works in the opposite direction than required, predicting the scattering pattern for a known particle size distribution. Hence, in the laser diffraction analysis, Mie theory must be used 'backwards', in an iterative process, to derive the size distribution from the measured scattering data. This process is as follows; the scattering data from the sample is measured, an initial guess at the size distribution is made. The Mie model can then be used to generate a scattering pattern, and any differences between the measured scattering and the calculated scattering can then be used to adjust the initial guess at the size distribution. This process is repeated until the differences between the measured and calculated scattering is minimized and the final size distribution is reported.
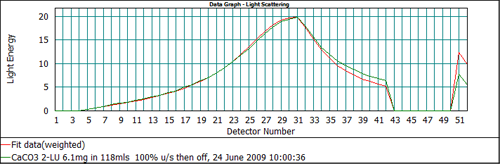
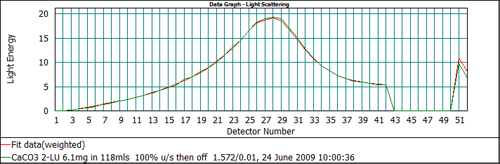
In addition to reporting the final size distribution, the Mastersizer software reports the measured scattering data and the calculated scattering data derived from the Mie model, allowing the user to assess how well the model has been able to fit the data. Figure 5 shows the fit to the scattering data for the calcium carbonate sample using an absorption of 0.1. The detectors which are most important when assessing the absorption value are channels 51 and 52. The response for these detectors relates to light extinction by the sample. If the value of the absorption used in the analysis is incorrect then there will be a misfit between the calculated and measured scattering data on these channels.

|

|
From Figure 5 it can be seen that the output of the Mie model predicts too high a signal on channels 51 and 52 when an absorption of 0.1 is used. This suggests that the absorption is too high. Recalculating the data with a lower value of the absorption, 0.01, gives the data fit shown in Figure 6, which shows a much better agreement between the measured and calculated data on all detectors. Therefore, for this calcium carbonate sample, the correct value to be used for the absorption is 0.01.
The volume concentration as calculated by the Mastersizer analysis can be used to determine the correct absorption value for a sample. This can be done by measuring a known sample concentration and comparing that to the calculated value. This has been tested for a calcium carbonate sample, where measurements were made at three known concentrations. By comparing these known concentrations to the calculated concentrations using absorption values of 1, 0.1, 0.01 and 0.001 the agreement was found to be best at around 0.1 and 0.01. Then, by inspecting the fit to the data using these two values of the absorption, the fit was found to be best using 0.01. Therefore, by using these two methods the correct value for the absorption was found to be 0.01. This conclusion was also supported by initial microscope observations.
|
|
[1] ISO13320 (1999). Particle Size Analysis - Laser Diffraction Methods. Part 1: General Principles.
[2] Rapid refractive index determination for pharmaceutical actives (MRK529-03)
[3] Empirical methods for estimating refractive index values (MRK843-01)