
The physical components and features of an Isothermal Titration Calorimeter (ITC) instrument and the technical specifications are clearly important to consider when purchasing a new system. However, written specifications can be confusing, misleading and may actually have very little bearing on the actual performance of the instrument. Specifications, on paper, do not necessarily translate into advantages or disadvantages when it comes to making measurements on your samples.
Here are some questions you should ask yourself as you begin evaluating isothermal titration calorimeters.
The physical components and features of an Isothermal Titration Calorimeter (ITC) instrument and the technical specifications are clearly important to consider when purchasing a new system. However, written specifications can be confusing, misleading and may actually have very little bearing on the actual performance of the instrument. Specifications, on paper, do not necessarily translate into advantages or disadvantages when it comes to making measurements on your samples. The best components and technical specifications in the world do not matter if the instrument is not assembled or optimized in a way that translates into real improvements in data quality and ease of use when you are working with your samples.
Here are some questions you should ask yourself as you begin evaluating isothermal titration calorimeters.
All vendors have their own jargon and ways in which they like to present their specifications and instruments. However, all considerations about ITC instruments must start with an understanding of your application requirements and how specifications and features impact upon them.
A popular way to assess the sensitivity of an instrument is to compare noise specifications. This may seem reasonable but these values are difficult to compare from one vendor to the next as each will define noise differently. The important, and related, factors to keep in mind are;
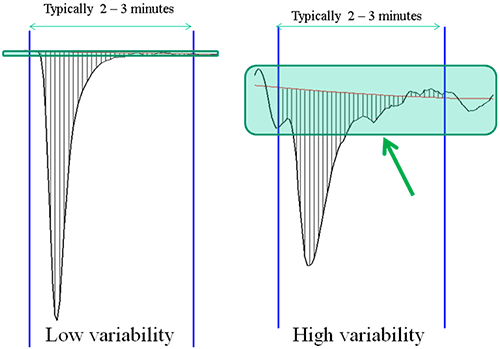
1/ the baseline variability over the duration of a typical injection and
2/ how accurately can you measure the area of an injection peak.
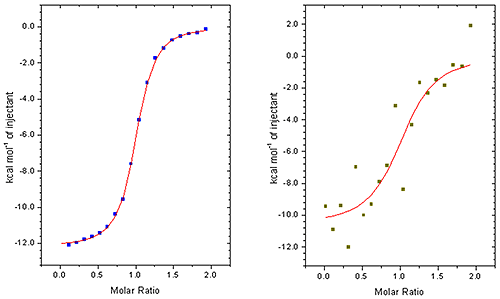
A good ITC binding curve is made up of a series of such injection heats and the accuracy to which the area of these peaks can be measured directly impacts the value of the KD and other parameters(see figure 1)
|
This is particularly noticeable when working at low sample concentrations when minimizing sample consumption is important or if measuring the affinity of tight interactions. (see figure 2)
|
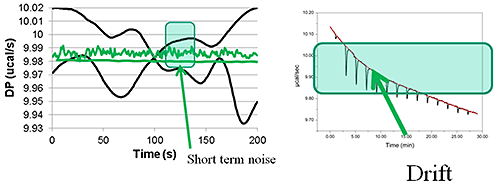
The baseline variability (see figure 3) from some vendors can be made to look OK but it is often the case that the raw data has gone through a round of subjective manipulations prior to the analysis process.
|
This is not only time consuming process but, perhaps more importantly, adds to uncertainty in the KD data and other parameters. When comparing ITC instruments it is good to make measurements at low concentrations so that the accuracy of peak area measurement can be really tested. Ideally, this process should be performed automatically in all but the most challenging cases. You should make sure that you try this procedure yourself so that you are fully aware of the process. The robustness of the procedure should be assessed by comparing the affinity and other thermodynamic parameters generated from repeat experiments.
There are a number of factors that can contribute to obtaining repeatable data even when performing measurements at higher concentrations. One factor is cleaning of the syringe. It is good laboratory practice to dry the injection syringe between experiments. Without drying the syringe it is easy to dilute your ligand material with the water or buffer used to clean it. Even 2 µl of water left behind in the syringe will dilute your ligand by 5% and this error will directly impact the measured enthalpy of the interaction by the same amount. Look for a calorimeter that allows for easy rinsing of the syringe with methanol and subsequent drying.
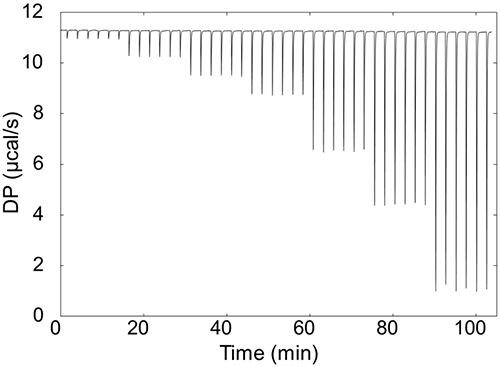
Another factor is injection repeatability. Your calorimeter should have a precision pipette that can deliver very low volumes with high repeatability.
|
The user interface with both the software and the hardware should be assessed. Ideally, both syringe loading and drying should be quick and easy. The cell port should be readily visible to aid in loading sample into the calorimetric cell and to make sure that air bubbles are not introduced into the experiment.
The ease of use of the software is, at least, as important. User friendliness is in the eye of the beholder, so check out the features that are most important to you. The best way to do this is to run the instrument and perform the data analysis yourself. By sending samples to vendor’s lab and receiving a report in the post at some time in the future will not help you to understand how to operate an instrument, run a sample or analyze data. Ask to use the software and run an experiment or two from start to finish. You’ll be glad you did because only then will you have a true understanding of how user-friendly the instrument and the software are for you.
The response time of an instrument can impact both the sample consumption and the time it takes to perform experiments. Response times can be calculated in different ways by different manufactures, however, it is straightforward to compare the response times of instruments simply by comparing how long it takes to run and set up experiments. The faster the response time the more experiments can be run in a day and in many cases it reduces the sample requirements.
If you foresee that the need for good calorimetric data growing in your laboratory then you should also consider a supplier that provides automated instruments and the possibility to upgrade your instrument to an automated platform.
Measuring the affinity of tight interactions in an ITC requires using low sample concentrations. As such, these are the most challenging experiments and requires the instrument to be able to measure small heats accurately. The ability of the instrument to do this depends on a number of factors, some of which have already been mentioned in this guide, such as baseline variability and response time. It also depends on the inherent heat of the binding process you want to measure. When checking the suitability of the instrument for measuring tight interactions there are a couple of things you should look for. The first is to work with samples at low concentrations and look at the variability in the affinities you derive from repeat experiments. The second is to check the literature, you should look for published data that shows good repeatability of these interactions and preferably displays the binding isotherms themselves and not just tables with numbers. Good literature examples include Lulf et al. 2014 (1.6 nM)1 and Ramakrishnan et al. 2012 (2.5 nM).2
Measuring weak interactions requires working at higher concentrations. In such cases you should look for instruments that are easy to load so as to minimize loading errors and the need to rerun measurements.
You should check the ability of the instrument for your specific applications. For instance, gold has thermal properties that make it suitable for measuring heat. However, if you want to measure the interactions of proteins with disulfides you should chose a calorimeter that has a cell that does not interact with thiol groups. It is well established in the literature that thiols, disulfides, and thioethers interact strongly with gold3. The strong sulphur-gold interaction enables the formation of densely packed self assembled mono-layers4. This binding may interfere with your results. In addition, the interaction with gold is strong and will require rigorous cleaning if you are to prevent the cell becoming coated with protein and contaminating subsequent experiments.
Confidence in your data can come from performing repeat experiments. However, when the sample is limited it is reassuring to know that you are using an instrument that is widely used in the scientific community and has a long history of generating high quality data for a broad range of applications. This can be done by scanning the literature and checking out what the high impact groups in your field have been using.
It is important to assess the reputation of the manufacturer or vendor that you use. ITC instruments must be manufactured using high standards and engineered by solid, technology leading companies in order to yield publication quality or decision making results.
Look for a manufacturer that has a suitable history of being at the forefront of developing and optimizing these instruments. These companies will produce instruments with little instrument to instrument variability and be the first to develop innovative advances to the technology and its applications. Such companies have been through the learning curve and you will benefit greatly as a result. These companies are much more likely to have the expertise, experience and support resources to not only build great instruments but also to support them properly.
Once you purchase your instrument your experience is really just beginning so it is important to purchase a system from a company that offers world class service and post-sales support.
Look for a company that can provide telephone, in –person and email support, ongoing training opportunities, field base service and expert level support. Before you purchase an instrument ask about what support is offered and may be ask to try some of these before making your decision so that you can get a feel for the quality and depth of the support you can expect once you have your new instrument installed in your laboratory.
Absolutely not.
ITC instruments can vary greatly in their design, quality and performance.
Even though different instruments may have specifications that look similar on paper, instruments vary greatly in real-life performance, quality and longevity. As with many things in life, the cheapest option is often not the best long-term value and usually winds up costing you more in the long run. Instruments that are slow and have poor repeatability end up costing a lot in terms of the extra sample and the time needed to generate data.