|
|
In the electronics industry solder paste is used extensively in the manufacture of printed circuit boards.
Solder paste is a suspension of solder particles in a flux-containing vehicle which is screen printed onto circuit boards. The solder particles must fuse together when heated to form a single solder mass. As well as the composition of the metal, the size and shape of solder particles are important properties. The industry standard ANSI/J-STD-005 describes the particle size designation for different types of solder and what proportions of larger particles are acceptable. Solder particles are normally classified in terms of size by sieving through meshes. The size range used will depend on the application and is a compromise between the ease of application for the paste pattern and the problem of surface oxide. Finer particles pass through a printing screen or syringe more easily and allow finer screens to be used providing greater definition. However, finer particles also result in a greater percentage of oxide for a given oxide layer thickness and may result in increased incidence of solder balling. It is also important to ensure there are no aggregates of solder balls or oversized solder balls which would not pass through the stencil. Generally, highly spherical solder particles are required. This is because for a given oxide thickness a sphere contains the smallest amount of oxide since it has a low surface area-to-volume ratio. Also non-spherical particles may block or jam the screen or stencil through which the paste is printed.
Monitoring the size and shape of solder particles is important in terms of quality control. The Morphologi® G3 Particle Characterisation System offers the ability to measure both the size and shape of solder particles in one measurement and records an image of every particle measured. The classification function also allows the proportion of misshapen or oversized particles to be identified.
In this example analysis, three different samples of solder (solder 1, solder 2 and solder 3) were measured and their size and shape distributions compared. Samples were prepared using the sample dispersion device and were measured using a standard operating procedure (SOP) on the Morphologi G3 Particle Characterisation System. A filter was set up so that all particle images containing less than 100 pixels were ignored to ensure good quality shape information. A classification describing touching particles was established and particles falling into this class were not included in the result. Further classes were set up to identify the proportion of spherical to misshapen/fused particles in each sample and the results were compared.
|
For each sample over 20,000 particles were measured in around 30 mins.
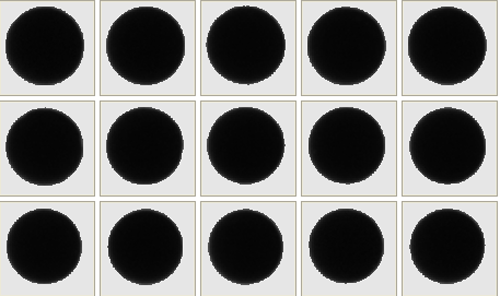
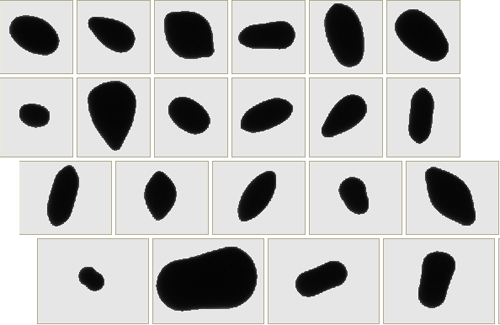
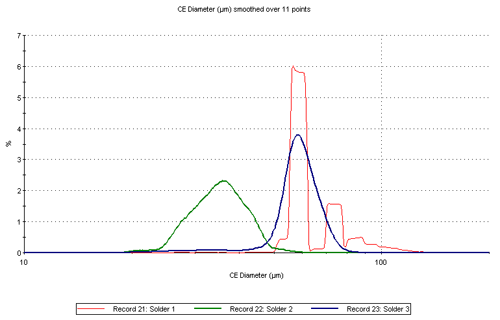
Figure 1 shows example images of the spherical solder particles whilst Figure 2 shows example images of the misshapen/fused solder particles. The Circular Equivalent (CE) Diameter size distributions expressed in number terms for the three different samples of solder are over-plotted in Figure 3 and a summary of the results are shown in Table 1.
| Sample | 1 | 2 | 3 |
|---|---|---|---|
| Mean | 65.38 | 35.60 | 58.71 |
| D[n,0.1] | 57.79 | 27.98 | 51.38 |
| D[n,0.5] | 61.78 | 35.47 | 59.02 |
| D[n,0.9] | 83.61 | 43.54 | 68.13 |
The particles in solder 2 are considerably smaller than those in solder 1 and solder 3 which are more similar to each other. Solder 1 however shows a trimodal distribution, the largest mode is centered at 58.87 µm, the second mode is centered at 73.92 µm and the third mode is centered at 84.08 µm; this will be discussed in more detail later in this application note. The size distribution of solder 2 and solder 3 are broader and mono-modal cantered at 36.96 µm and 57.14 µm respectively.
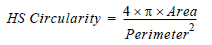
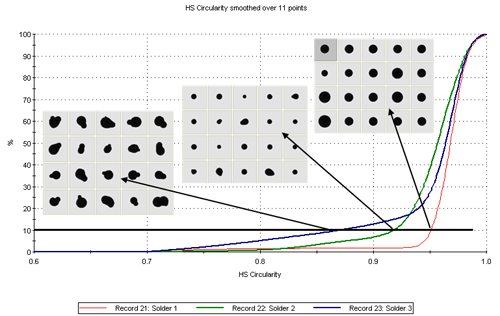
High sensitivity (HS) circularity is a measure of how circular a particle is and is calculated by the equation:
An over plot of the undersize shape distribution in terms of HS circularity for the three samples of solder is shown in Figure 4. The figure shows that solder 3 is the least circular of the samples of solder analyzed with a higher proportion of lower circularity particles. Solder 1 contains the most circular particles. Also shown in Figure 3 are example images of particles that have HS circularity values around the 10th percentile for each sample.
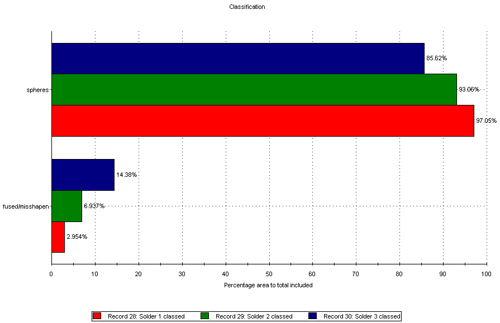
All the samples appeared to contain some misshapen/fused particles such as those shown in Figure 2. Classifications were set up and applied to the original results to identify the proportion of misshapen/fused particles compared to the primary spherical particles in each sample. The parameters used for each class are shown in Table 2.
| Spheres | HS Circ ≥ 0.850
Elongation ≤ 0.2 |
| Fused/misshapen | HS Circ ≥ 0.650
Elongation > 0.2 Solidity > 0.89 |
Figure 5 compares the proportions of the different types of particle in each sample. In agreement with the overlay of the shape distributions shown in Figure 4, solder 1 contains the highest proportion of spherical particles whilst solder 3 contains the highest proportion of misshapen/fused particles.
|
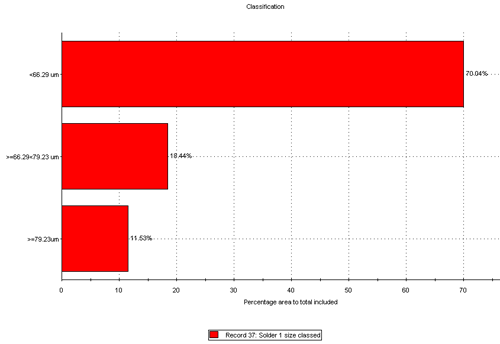
As mentioned previously, solder 1 appears trimodal in terms of size distribution. A second post analysis classification was therefore carried out to investigate the proportion of particles in each size band. The classification was set up according to CE diameter in the follow three size brackets:
The proportion of particles in each size class is shown in Figure 6 .
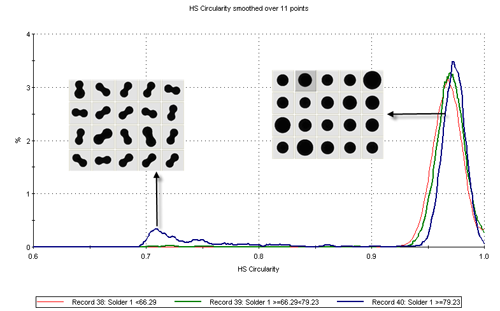
Further, 3 new results were calculated each of which contained only the particle images from one of the size brackets so that the shape of the particles in each size bracket could be compared.
Figure 7 shows the HS circularity distribution for the particles of solder 1 from the three individual size brackets. The two smaller size brackets both contain highly spherical particles whereas the largest size bracket is bimodal in terms of the HS circularity distribution. The largest size bracket contains both the most spherical particles of the three size brackets and the least since it also contains dumbbell shaped particles. Example images of particles in the largest bracket from each mode in terms of HS circularity are also shown in Figure 7 .
|
|
|
The Morphologi G3 Particle Characterisation System provides an effective method of monitoring the quality of solder particles in terms of both size and shape distributions which is important in terms of quality control. From only one measurement a substantial amount of data on each sample can be obtained by simply using the filtering and classifying functions to concentrate on particles of particular interest. Additionally particle images of every particle measured are retained which enable validation of observations made from distributions.
ihttp://en.wikipedia.org/wiki/Solder_paste
iihttp://www.ami.ac.uk/courses/ami4812_map2/u02/spb/index.asp