Careful control of micron scale bead size is extremely important in a wide range of applications. These can include, among others, sensors, medical devices, chromatography, and material fabrication. In addition, careful control of shape is also necessary. The presence of more ellipsoidal beads rather than spherical beads or the presence of fused spheres may lead to problems with product performance.
Monodisperse spherical beads will pack in a way that results in a fairly well defined network of pores that can be exploited in sensing applications. For example, a medical sensing device can depend on agglomeration of a protein to give a positive result. In this case, the agglomerated protein will not pass through the channels. A negative result is obtained when there is no agglomeration and no sample retention. The presence of fines in the packing material can block these pores and render the device unreliable by causing retention of smaller particles.
Analysis of these types of bead samples can be done using manual microscopy. However, getting statistically significant results using manual microscopy is time consuming. This can lead to operator fatigue and is also subject to operator variability due to the manual nature of the measurement.
The Morphologi® G3 particle characterization system allows for an automated measurement of size and shape parameters. The automated measurement can be performed considerably quicker than a manual microscopy measurement and is not subject to the same operator variability.
The current example will focus on beads in suspension, but analysis of dry powder beads can be done in a similar manner.
Two polymer bead samples were studied, one with a nominal size of 20 µm and one with a nominal size of 40 µm. The samples were prepared by placing one drop of the aqueous suspension of beads on a glass microscope slide. The sample was then covered with a coverslip.
The analysis of the samples was carried out using a standard operating procedure (SOP) that defined all the software and hardware variables. The SOP used the 5x magnification objective and diascopic illumination. The scan area dimensions were defined in the SOP, but the exact scan area was optimized to match the placement of the coverslip. A convexity filter was used to remove any loosely touching beads from the analysis. For each analysis ~ 7000 particles were measured in approximately 2 minutes.
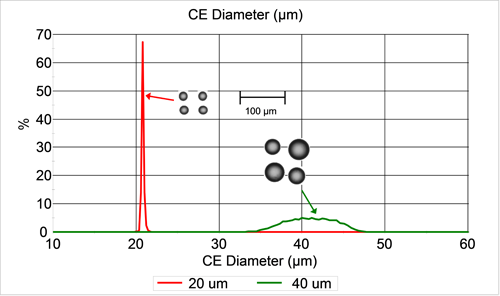
Figure 1 shows a comparison of the number-weighted circle equivalent (CE) diameter distributions for the two bead samples along with example images. CE diameter is the diameter of a circle with the same area as the particle image. Both samples appear to have an average size that is slightly larger than the nominal diameter, but still within the material specification. The 20 µm sample appears to be much more monodisperse than the 40 µm sample.
|
In addition to the qualitative impression from the size distributions, the monodispersity can be quantified.
Table 1 shows the statistics of the size distributions for the two bead samples. The D[n,0.1], D[n,0.5], and D[n,0.9] values are the size at which 10%, 50%, and 90% of the particles are smaller on a number-weighted basis. The ratio D[n,0.9]/ D[n,0.1] is an excellent measure of the monodispersity of the sample. The RSD is the relative standard deviation and is another measure of the monodispsersity.
| Sample | D[n,0.1] (µm) | D[n,0.5] (µm) | D[n,0.9] (µm) | D[n,0.9]/ D[n,0.1] | Mean (µm) | STDV (µm) | RSD % |
|---|---|---|---|---|---|---|---|
| 20 µm | 20.53 | 20.71 | 20.92 | 1.02 | 20.93 | 0.19 | 0.92 |
| 40 µm | 36.84 | 40.58 | 44.43 | 1.21 | 40.99 | 3.03 | 7.38 |
All of the relevant measurements confirm that the 20 µm sample is much more monodisperse than the 40 µm sample. For applications that require an extremely tight size range, the 20 µm sample may provide the required functionality while the 40 µm sample may not.
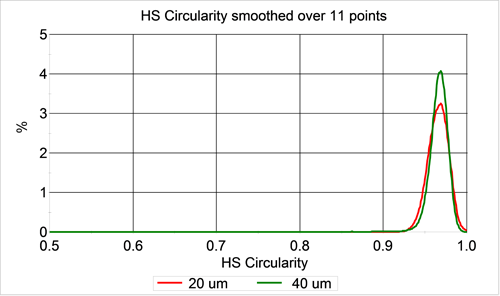
In addition to size, the Morphologi G3 also calculates a variety of shape parameters for each measured particle. One such shape parameter is High Sensitivity (HS) Circularity, which is a measure of how close the 2D particle image is to a perfect circle. A perfect circle has an HS circularity of 1, and any deviations from a circle will reduce the HS circularity value.
Since a perfectly spherical particle should result in a circularity of 1, the HS circularity parameter should reveal information about any non-spherical particles in the samples. Figure 2 shows a comparison of the HS circularity distributions for the two samples. As expected, both samples have very high circularity. The HS circularity distributions overlap, indicating a high level of similarity in terms of circularity.
|
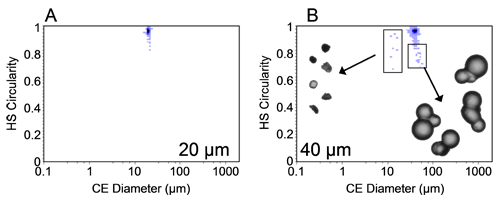
The Morphologi G3 software includes a scattergram that allows the user to plot any two parameters against each other. This can help reveal information that is not obvious from a single parameter distribution plot. This is especially useful to identify parameters varying in a small number of particles. Figure 3 shows scattergrams of CE diameter vs HS circularity for the two bead samples.
Figure 3 indicates that the 40 µm sample has some fine material present and significantly more non-spherical beads than the 20 µm sample.
|
It is possible to highlight a portion of the scattergram and examine the selected particle images. Figure 3B shows selected portions of the scattergram for the 40 µm sample and representative images of the selected particles.
Irregularly shaped fines are present in the 40 µm sample and some particles actually appear to be multiple spherical beads that have been fused. These fused particles included examples where small spheres are fused to larger spheres as well as cases where similar sized spheres are fused.
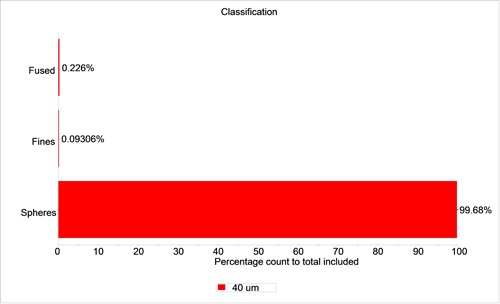
It is possible to use the selected region in the scattergram to define a class. After the classes have been defined, it is straightforward to quantity the number of particles in each class. The number of each class can be represented by particle number or by percentage, weighted by number, area, or volume.
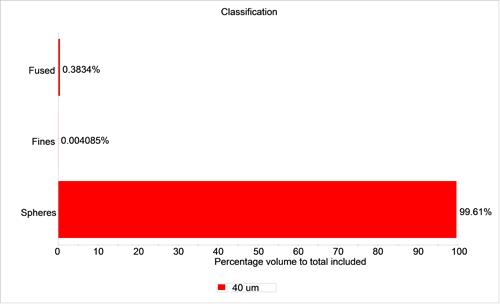
Figures 4 and 5 show graphs of the percentage of particles in each class for the 40 µm sample by number and volume respectively.
|
|
For the 40 µm sample, there were 17 particles in the fused sphere class and 7 particles in the fines class out of a total of 7522 particles. These correspond to number-based percentage of 0.23% and 0.09%, respectively. The volume-based percentages are 0.383% and 0.004%, respectively. If criteria are set in regard to the amount of fine or fused material that is allowed for the product to pass specification, a report with a pass/fail flag can be automatically generated.
The Morphologi G3 particle characterization system is ideally suited to determine quality and monodispersity of micron sized beads. The Morphologi G3 can also be used to identify any non-spherical particles. The 20 µm sample was found to be much more monodisperse than the 40 µm sample. The 40 µm sample was also found to have more fine material and more fused beads than the 20 µm sample. The fact that the measurement is automated drastically decreases measurement time and helps to remove user variability that can affect the results of manual microscopy measurements.