Prepared by Chan Wook Park, Malvern Korea
Recently, a magnetically tuneable photonic crystal system has been developed by assembling highly charged Fe3O4 colloidal nanocrystal clusters (CNCs) [1,2]. They have attracted much attention because of their optoelectronic applications such as photonic components in tele-communication devices, lasers, sensors, drug delivery system (DDS) and MRI contrast agents [1,2].
Stabilized by the balance of attractive (magnetic) and repulsive(electrostatic) forces, the colloids form ordered structures along the direction of the external magnetic field with a regular interparticle spacing on the order of hundreds of nanometers. As a result, the solutions strongly diffract visible light [1,2]. CNCs can tune the diffraction wavelength throughout the entire visible spectrum by changing the strength of the external field [1,2]. The tuning range of the diffraction wavelength is related to the average size of the colloidal nanocrystal clusters. In general, crystals of large clusters (160-180 nm) preferentially diffract red light in a relatively weak magnetic field. Small clusters (60-100 nm) form ordered structures only when the magnetic field is strong and the crystals preferentially diffract blue light [1,2].
The size and dispersion stability of the photonic crystal system can be characterized by measuring the mean particle size and zeta potential respectively, because the optical response is sensitive to both the size of the colloids and the ionic strength of the solution.
Alkanol solutions of Fe3O4@SiO2 colloids show significant long-term stability in photonic activity [2]. These, Fe3O4@SiO2 core/shell particles were dispersed in ethanol and measured, in this work, using the Zetasizer Nano ZS.
Size and zeta potential measurements were performed on five different samples. All measurements in this study were taken at a temperature of 25°C. The Nano ZS uses a 4mW He-Ne laser operating at a wavelength of 633nm. Both size and zeta potential measurements were performed using folded capillary cells. All samples were measured 3 times to check for result repeatability.
The z-average diameter (the intensity-weighted mean diameter) and the polydispersity index values (an estimate of the distribution width) were calculated from the cumulants analysis as defined in ISO13321 [3] and ISO22412 [4]. The intensity particle size distributions (PSDs) were obtained from analysis of the correlation functions using the General Purpose algorithm in the Zetasizer software. This algorithm is based upon a non-negative least squares fit [5, 6].
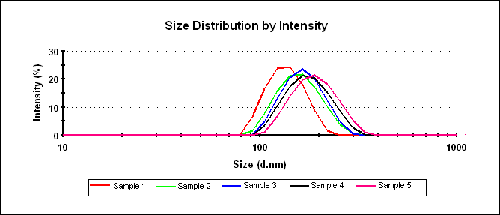
Table 1 shows the results obtained from three repeat sizing measurements and summarizes the z-average diameters and polydispersity index (PDI) results for each sample. Figure 1 shows over plots of the intensity PSDs obtained for the 5 Fe3O4@SiO2 core/shell particles dispersed in ethanol.
|
Sample | z-Average Diameters (nm) | PdI (Average) | |||
|---|---|---|---|---|---|
1st | 2nd | 3rd | Average | ||
Sample 1 | 132.3 | 132.6 | 133.3 | 132.7 | 0.006 |
Sample 2 | 152.4 | 153.3 | 152.9 | 152.9 | 0.034 |
Sample 3 | 159.1 | 161.9 | 160.8 | 160.6 | 0.037 |
Sample 4 | 171.5 | 169.4 | 168.2 | 169.7 | 0.033 |
Sample 5 | 181.5 | 182.5 | 181.4 | 181.8 | 0.058 |
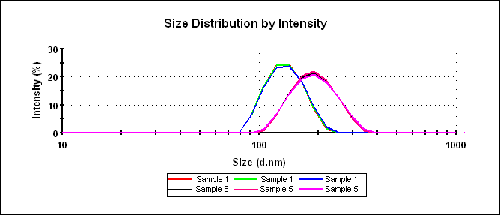
Figure 2 shows the intensity PSDs obtained for samples 1 and 5 to illustrate the repeatability of the results and also the differences between the two samples. The very low polydispersity index values shown in Table 1 indicate that all of the samples are monodisperse.
|
Table 2 summarizes the zeta potential results obtained for the 5 Fe3O4@SiO2 core/shell particles dispersed in ethanol. All zeta potential values are negative because of the silica shell structure of the particles. The repeatability of the results is good and the values are about -50mV indicating that the samples are very stable.
Sample | Zeta Potential (mV) | |||
|---|---|---|---|---|
1st | 2nd | 3rd | Average | |
Sample 1 | -53.7 | -52.0 | -52.9 | -52.6 |
Sample 2 | -52.7 | -52.5 | -52.2 | -52.5 |
Sample 3 | -49.1 | -50.7 | -49.5 | -49.7 |
Sample 4 | -51.7 | -51.5 | -49.9 | -51.0 |
Sample 5 | -48.4 | -50.3 | -49.3 | -49.3 |
It has been widely accepted that for an ethanol dispersion of silica, a wetting film of solvent formed on the silica surface through the hydrogen bonds can significantly stabilize the system and this is probably contributing to the result in this case [2].
The Zetasizer Nano ZS system can be used to characterize the size and dispersion stability of colloidal photonic crystal solutions easily and quickly.
[1] Angew. Chem. Int. Ed. (2007) 46, 7428 -7431.
[2] Adv. Mater. (2008) 20, 3485-3491.
[3] International Standard ISO13321 (1996) Methods for Determination of Particle Size Distribution Part 8: Photon Correlation Spectroscopy. International Organization for Standardization (ISO).
[4] International Standard ISO22412 (2008) Particle Size Analysis: Dynamic Light Scattering (DLS). International Organization for Standardization (ISO).
[5] C.L. Lawson and R.J. Hanson (1995), Solving Least Squares Problems. Society for Industrial and Applied Mathematics (SIAM), Philadelphia.
[6] S. Twomey (1997) Introduction to the Mathematics of Inversion of Remote Sensing and Indirect Measurements. Dover Publications, New York.