This application note describes how the combination of automated image analysis with Raman spectroscopy can deliver component specific particle characterization data for pharmaceutical blends such as topical formulations.
Most pharmaceutical products comprise active and inactive component(s) that are blended in some way. Although the particle size distribution of the individual components is easily determined before the blending step, the ability to make this determination on the resultant blend can be much more difficult. The active pharmaceutical ingredients (API) is typically the most valuable component present in a blend and as such it tends to be the focus of most quantitative analyses performed.
Component specific particle characterization in a blend can provide information regarding homogeneity and potency of a single component. Additionally it can determine if the manufacturing process has changed the particle size or shape that may result in potential performance issues. The most common methods for performing such an analysis use manual microscopy and visual identification of the active particles within a blend dispersion, which can be time consuming, subjective, and inaccurate.
This application note describes how the combination of automated image analysis with Raman spectroscopy in the Morphologi G3-ID can be applied to increase both the accuracy and robustness of these types of measurements by chemically identifying and isolating the particles of interest within a topical cream formulation.
A commercially available topical cream sample containing two active ingredients was manually dispersed onto an aluminum coated microscope slide by smearing a small amount very thinly. A spectral reference library was created for the sample by taking point spectra of separate samples of the "pure" active components.
The sample was automatically measured by image analysis on the Morphologi G3-ID according to a Standard Operating Procedure (SOP) which determined the particle size and shape distributions of the blended sample.
The analysis also determined the x-y coordinates the individually measured particles and these were used to direct the Raman part of the analysis determining the chemical identity of particles of interest. The library and particle spectra were preprocessed to minimize baseline variation and normalized to minimize differences in peak intensities.
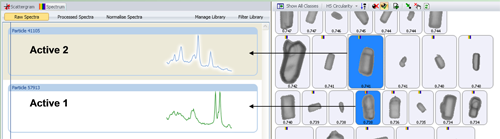
The chemical identity of a particle is determined by correlating its spectrum against the library spectra. The correlation was performed from 1250 - 1730 cm-1, rather than across the entire spectral range, as the truncated range included the main bands for both actives. The more similar a particle spectrum is to a library component, the closer its correlation score is to 1. Figure 1 shows example particle images and Raman spectra for the two actives of interest. The particles were further classified based on their designated chemical identity. The individual particle size distributions (PSD) were determined for each of the resulting chemical population.
|
The automated image analysis results alone could not be used to differentiate between the two APIs since they were morphologically similar to each other. Figure 1 shows example particles which are similar in shape but have quite distinct Raman spectra.
Figure 2 shows the scattergram plot of the correlation score for active 1 verses the correlation score for active 2 along with representative example particle images. The chemical information allows unambiguous differentiation of the two active populations. Classes were applied to the results based on the chemical correlation which allowed particles of the two individual active components to be separated from the rest of the blend. The particle size distributions (PSD) of each was then determined.

|
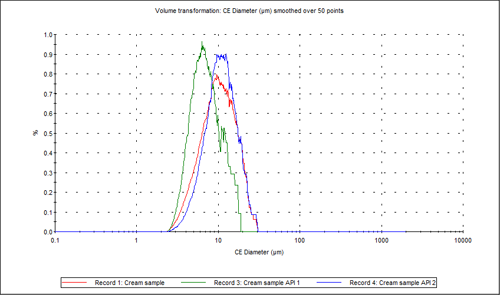
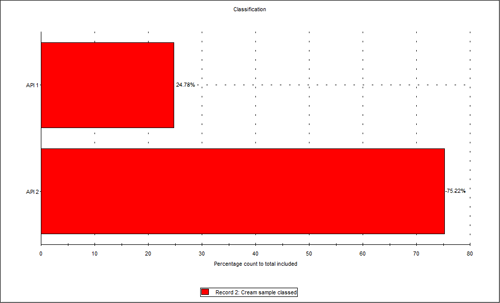
Figure 3 shows the overlay of the circular equivalent diameter (CED) distributions by volume of the cream sample and the two individual APIs from the chemically defined populations. It shows that in the cream sample analyzed, the API 2 particles contribute to the larger end of the distribution with API 1 contributing more to the smaller particles in the formulation. Figure 4 shows the proportions of the two actives in the blend relative to each other in a classification chart in percentage count. This shows that there was approximately three times the number of API 2 particles than API 1 particles in the sample analyzed.
|
|
The combination of automated particle imaging and Raman spectroscopy in one instrument allows the individual components present within a blend or mixture to be independently characterized and compared. Such a tool can be used to gain a better product understanding across many areas of the pharmaceutical industry from regulatory to troubleshooting. It is not, however, limited to pharmaceuticals alone and is also applicable to other Raman active samples.