The stability and purity of biotherapeutic formulations can impact the safety and efficacy of the product and is therefore a major concern for pharmaceutical regulators. Aggregation of proteins and the presence of contaminants are two leading causes instability and impurity. The combination of static microscopy and Raman spectroscopy in the Morphologi® ID enables automated chemical identification of protein aggregates and other contaminants in a biotherapeutic sample, either in suspension via a thin-path wet cell or on a filter membrane.
Optical microscopy has long been used to characterize particulates present in biotherapeutic formulations, providing their size, shape, and transparency characteristics, which can then be used to group particulates into distinct classes (i.e. aggregates, silicone oil, sundry contaminants). However, the ability of a microscope to provide explicit identification is limited to the two-dimensional images it collects. The addition of Raman spectroscopy to an automated microscopy system provides a robust primary identification method for the verification of particle chemistry, and together the techniques offer the potential to enumerate, characterize, and identify particulates in native formulations, as well as those immobilized on a filter substrate. This range of capabilities directly addresses FDA quality requirements for drugs administered by injection, in terms of particulate count per unit volume. These regulations are put into practice through USP <788>1, which calls for enumeration of particulates in two size categories: larger than 10 μm and larger than 25 μm. The more recent release of USP <787>2 (and <1787>) has extended recommendations to include sizes below 10 μm. This lower size range has drawn considerable attention from the FDA due to concerns about immunogenic response related to proteinaceous aggregates3, reduced product efficacy, and general safety. Formulation stability can be affected by many factors that lead to the formation of aggregated material4,5.
The Morphologi® ID; a hybrid optical microscope-Raman spectrometer from Malvern Panalytical, provides the imaging power of a high-resolution optical microscope with the chemical identification capabilities of a benchtop Raman spectrometer, and can be completely automated. This application note explores the use of the Morphologi ID for Morphologically-Directed Raman spectroscopy (MDRS®) to identify and analyze contaminants including protein aggregates present in a stressed sample of lysozyme, and to compare particles held in suspension within a thin path wet cell with those collected on a filter membrane.
A Morphologi ID from Malvern Panalytical was used to locate particulates for morphological characterization (size, shape, and transparency), and identify the species chemically using Raman spectroscopy. The Morphologi ID was run with a magnification of 10x, providing an effective lower size limit of 2 μm for particle count. The practical upper size limit at this magnification is around 200 μm, although this can be extended significantly with the included particle stitching routine, which is capable of “reassembling” the images of particulates that span more than one field of view. Raman spectra were collected using a 3 μm spot at 50x magnification of 785 nm excitation (~20 mW) from 150 cm-1 to 1850 cm-1 at 6 cm-1 resolution.
Two separate 100 mg/mL, pH 7.1 solutions of lysozyme were stressed to produce aggregates: one was used for the filter-based analysis and the other for the suspension-phase analysis.
Membrane Filter
One of the lysozyme preparations was stirred rapidly at room temperature for 16 hours. Aliquots (1 mL) of this aggregated suspension, spiked with a small amount of polystyrene latex spheres as a reference species, were vacuum filtered using a 47 mm cellulose-based Millipore GSWP filter. The filter was taped to a glass slide and allowed to dry before examination. A circular scan area of 15 mm radius was scanned at 10x magnification in order to characterize particulates and record their locations. The particulates were then divided into groups according to their size and morphology, and a subset of each group was chosen for Raman spectral analysis.
Suspended Sample
The second lysozyme preparation was stirred at 45oC for four hours and then analyzed in suspension-phase. An aliquot (55 μL) of suspension was delivered to a proprietary thin-path wet cell (25 μm path length) with quartz windows. The cell was allowed to reach thermal equilibrium for 15 minutes before examination. A 20 mm radius scan area was investigated, corresponding to 31.4 μL in volume.
The size groups defined for particle counting included 2 μm to 10 μm (small), 10 μm to 25 μm (medium), and greater than 25 μm (large), with the addition of a specific group for the 40 μm polystyrene latex spheres. A selection of images from each group of particles detected on the membrane filter sample is shown in Figure 1.
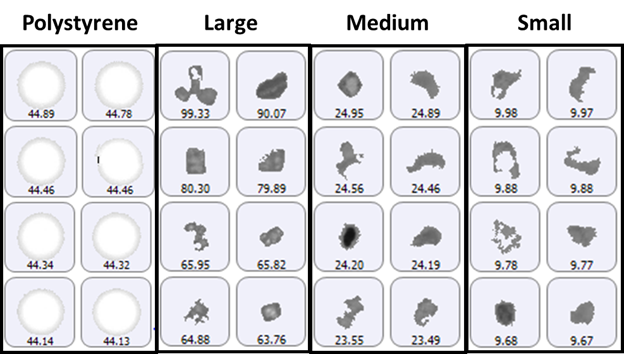
Figure 1: Representative particle images from each size band defined for the lysozyme sample on a membrane filter. Note that the scale is not the same for each group.
The polystyrene particles were bright white in color due to the top-light (episcopic) illumination geometry used to collect data. Particles from the aggregate groups appeared darker and had a variety of shape characteristics. The final count data is shown in Figure 2.
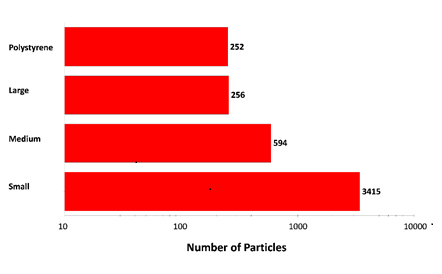
Figure 2: Particle counts collected for a mixed sample of lysozyme aggregates and 40 µm polystyrene latex on a membrane filter. Note the logarithmic x-axis
The results displayed in Figure 2 show increasing particle counts as particle size decreases, and that similar numbers of large aggregate-type particles and polystyrene particles were detected in the experiment. The overall particle count was much higher than would be expected for a commercial sample that has not been stressed, but serves to illustrate the counting and characterization capabilities of the Morphologi ID.
Raman spectra were collected for 30 particles from the group labeled polystyrene. Of these, 29 were identified as polystyrene latex, and one gave a proteinaceous spectrum. After examination, there appeared to be a lysozyme aggregate in proximity to the polystyrene particle that gave rise to the recorded spectrum. Additionally, 14 spectra were collected from the large (> 25 um) group. All spectra were collected for 30 seconds integration time at the available low power settings (~5 mW). Of the 14 additional spectra collected, 13 were identified as lysozyme aggregates, and one gave rise to a broad fluorescence spectrum and was taken to be rubber (inset, green spectrum). Example spectra of the background filter, a proteinaceous particle, a latex sphere and a rubber particle are shown in Figure 3. The spectra collected for the sample illustrate the ability of the Morphologi ID to identify subvisible particulates on a membrane filter, even when they are weak-scattering materials such as protein aggregates.
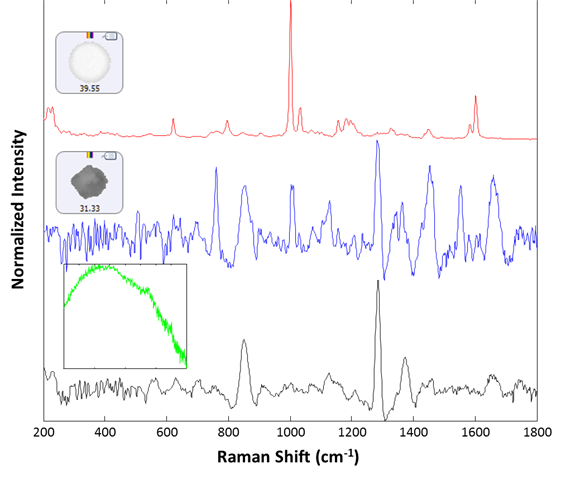
Figure 3: Representative spectra collected from the filtered lysozyme sample: membrane filter background (black), lysozyme aggregate (blue), polystyrene sphere (red). The inset (green) shows the spectrum of a rubber particle that was found in the sample
A selection of images from each group of particles examined in the thin-path wet cell are shown in Figure 4. Observation of these particle images revealed a distinctly different particulate morphology than that recorded for the samples captured on the membrane filter. The filtered aggregates appeared to be crystalline, while those observed for the suspended samples appeared more diffuse. In fact, it could be argued that the particulates in the lysozyme suspension seemed to be a series of smaller aggregates collected together in a larger body (Figure 5). This result suggests that changing the stress conditions (sample preparation and/or collection) may have altered the aggregation mechanism for lysozyme.
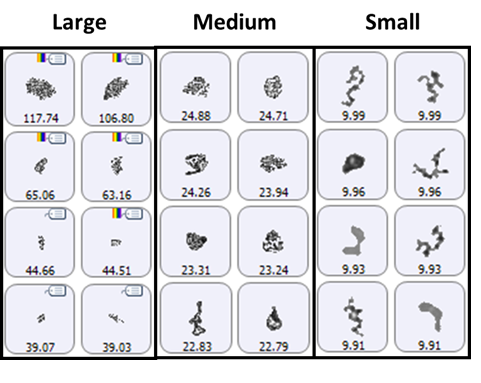
Figure 4: Representative particle images from each of the size bands defined for the lysozyme sample in suspension. Note that the scale is not the same for each group.
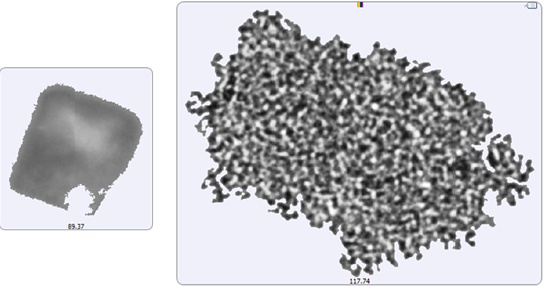
Figure 5: Image of the largest recorded aggregate particle from the filtered sample (left) and from the suspended sample (right)
The morphological results for the suspended sample were grouped according to size in the same fashion as for the filtered sample: size bins covering 2 μm -10 μm (small), 10 μm - 25 μm (medium), and 25 μm+ (large), with the results summarized in Figure 6.
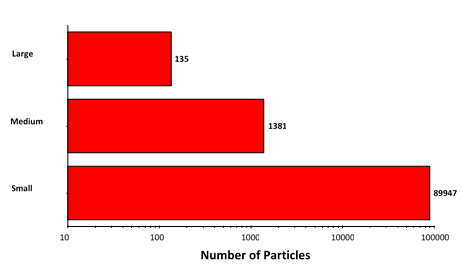
Figure 6: Particle counts collected for the suspended lysozyme sample. Note the logarithmic X-axis
Particle counts were considerably higher for the suspended sample than for the filtered sample, except in the case of the largest aggregates. This result, together with the observed morphology of the two sample types, does suggest that the aggregation mechanism differs between the samples.
Particle spectra were collected for a small series of the large aggregates at 2 minutes integration time. 25 particles were examined, with three identified as cellulose and the other 22 identified as proteinaceous. Example spectra are shown in Figure 7.
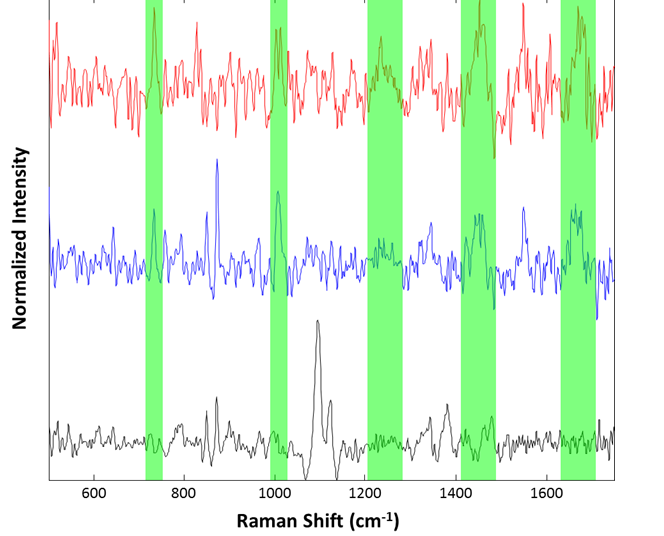
Figure 7: Representative spectra collected from the suspended lysozyme sample: Cellulose particle (black), lysozyme aggregates (blue and red). Regions associated with common Raman features for proteinaceous materials are highlighted in green
Although the spectra are noisy, identification of the species was accomplished using approximate band positions. For example, the red and blue spectra were identified as proteinaceous by examination of the 760 cm-1 tryptophan band, the 1000 cm-1 phenylalanine band, the 1250 cm-1 Amide III band, 1400 cm-1 asymmetric CH2 stretch band, and the 1650 cm-1 Amide I band. The spectrum in black, that of a cellulose particle, shows the characteristic ~1100 cm-1 doublet and ~1400 cm-1 triplet of cellulose. Thus, even for microspectroscopy on 50 μm particles in suspension, the Morphologi ID can provide spectra useful for identification of particulates.
It should be noted that no conclusions have been drawn regarding detailed structural information about the proteinaceous particles seen either on the filter or in suspension,e.g. α-helix,β-sheet, or random coil conformations. Data collection times could be increased to improve the signal-to-noise ratio of the spectra, which may provide more detail.
Particulate enumeration and characterization are of particular interest in the field of biotherapeutic formulation. USP <788> calls for the assessment of particles in the 10 μm to 25 μm and also the 25 μm and larger size ranges. However, there is new industry interest in accessing the sub-10 μm size range, in line with expectations for new FDA suggestions. Optical microscopes, such as the Morphologi ID, are well-suited to operation in this size range, and offer the promise to provide high-resolution images and 100 percent particle counting for the sample volume delivered.
Raman spectroscopy extends these capabilities, allowing for chemical identification of particles. This directly addresses the requirements outlined in USP <787> for enumeration and morphological characterization, with the added strength of direct explicit chemical identification of subvisible (2 μm -100 μm) particles. Raman spectroscopy is well known as a technique with high chemical specificity, and is capable of discriminating between chemically-similar materials due to the unique vibrational structure of discrete chemical entities. Typically, unknown materials are identified through interrogation of a library of reference materials that can be updated to include user-specific compounds.
The combination of automated microscopy and Raman spectroscopy was used successfully to detect and identify particulate species from lysozyme samples both held in suspension within a thin-path wet cell and also after filtration through a membrane. This technology combination offers users the flexibility to measure samples in their native state, or to isolate particulates on a substrate suitable for further analysis methods. Particle morphology may be used to distinguish between extrinsic contaminants and aggregates, as well as between different types of aggregates. Additionally, this technique offers the promise to study structural differences between aggregate species through changes in their Raman spectra.
1. United States Pharmacopeia, <788>: Particulate Matter in Injections
2. United States Pharmacopeia, <787>: Subvisible Particulate Matter in Therapeutic Protein Injections
3. A.S. Rosenberg, Effect of protein aggregates: an immunologic perspective. The AAPS Journal 8, E501-E507 (2006)
4. H.C. Mahler, W. Friess, U. Grauschopf, and S. Kiese, Protein Aggregation: Pathways, induction Factors and Analysis. Journal of Pharmaceutical Sciences 98 (9), 2909-2934 (2009)
5. S. Amin, G.V. Barnett, J.A. Pathak, C.J. Roberts, and P.S. Sarangapani, Protein aggregation, particle formation, characterization & rheology. Current Opinion in Colloid & Interface Science (2014)