In this report, the reproducibility and long-term stability is shown of the PANalytical 2830 ZT Wafer Analyzer in determining the boron and phosphorus concentration and film thickness of BPSG films. For the determination of the boron concentration, the gauge capability will be shown as a function of process tolerance.
In the semiconductor industry the monitoring of the deposition process of dielectrics such as BPSG is a demanding analytical application, requiring both high measurement accuracy and excellent precision. Wavelength dispersive X-ray fluorescence has been proven to meet these criteria.
In the semiconductor industry the monitoring of the deposition process of dielectrics such as BPSG is a demanding analytical application, requiring both high measurement accuracy and excellent precision. Wavelength dispersive X-ray fluorescence (WDXRF) has long been proven to meet these criteria. Films between 100 and 1250 nm are routinely analyzed for boron and phosphorus concentration. In addition to measuring these dopant concentrations, XRF allows simultaneous determination of the BPSG film thickness.
In this report, the reproducibility and long-term stability is shown of the Malvern Panalytical 2830 ZT Wafer Analyzer in determining the boron and phosphorus concentration and film thickness of BPSG films. For the determination of the boron concentration, the gauge capability will be shown as a function of process tolerance.
A Malvern Panalytical 2830 ZT equipped with fixed Si Kα and P Kα channels is used. In addition, a new generation extreme high performance B Kα channel is used to obtain the ultimate sensitivity for boron. Details of the measurement conditions are presented in Table 1.
| Tube | Tube setting | Channels | Measurement time | Spot size | Software package |
|---|---|---|---|---|---|
| 4 kW Rh anode,
SST-mAX50 | 32 kV
125 mA | Fixed channels: Si Kα, P Kα,
Fixed extreme high performance channel: B Kα | 30s, 60s, 100s |
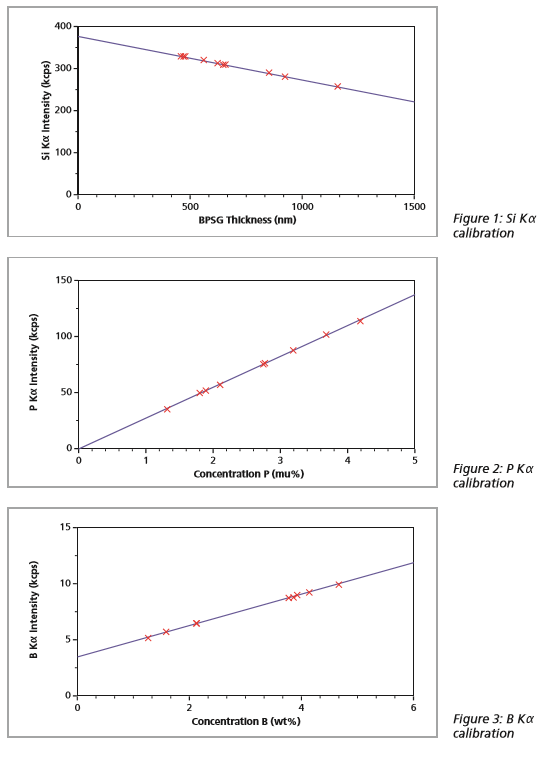
The Si Kα signal from the wafer is partially absorbed by the BPSG film, which results in reduction of the signal strength with increasing film thickness. The inverse relationship between thickness and intensity forms the basis for thickness measurement.
The information depth of the P Kα radiation is larger than the typical BPSG film thickness. Therefore, the intensity of the P Kα depends both on concentration and thickness. By taking the product of thickness and concentration as calibration unit these two effects can be combined. The resulting unit mu% (μm × wt%) therefore includes both parameters. In the actual analysis, the phosphorus weight concentration can be determined by dividing the obtained P (mu%) value with the thickness obtained via the Si Kα calibration.
The information depth of B Kα in BPSG is around 250 nm. For thinner films, the same calibration procedure must be applied as the one described for P Kα. For thicker films, the B Kα intensity is independent of film thickness and can be related directly to the boron concentration.
In the Figures 1, 2 and 3 the thickness, P(mu%) and B(wt%) calibrations are shown, respectively.
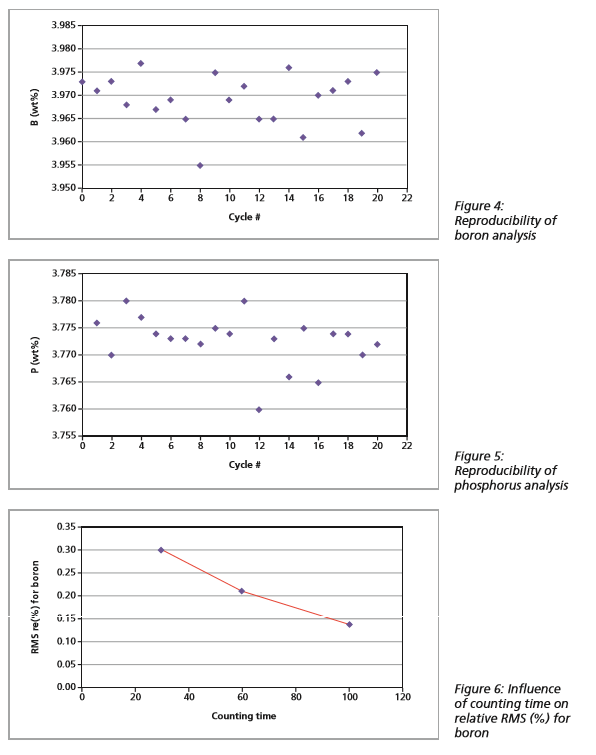
Short-term reproducibility
The short-term reproducibility is determined by measuring a BPSG film 20 times at the center spot, while unloading the wafer after each measurement. Three counting times were used: 30, 60 and 100 seconds. The results obtained for 100 s are shown are shown in Table 2 and the Figures 4 and 5.
Figure 6 shows the influence of the counting time on the relative root mean square (RMS rel.) of the boron analysis.
| Cycle | B (wt%) | P (wt%) | Thickness (nm) |
|---|---|---|---|
| 1 | 3.971 | 3.776 | 482.15 |
| 2 | 3.973 | 3.770 | 482.52 |
| 3 | 3.968 | 3.780 | 481.56 |
| 4 | 3.977
| 3.777 | 481.50 |
| 5 | 3.967 | 3.774 | 482.67 |
| 6 | 3.969 | 3.773 | 482.51 |
| 7 | 3.965 | 3.773 | 482.55 |
| 8 | 3.955 | 3.772 | 482.47 |
| 9 | 3.975 | 3.775 | 481.55 |
| 10 | 3.969 | 3.774 | 481.82 |
| 11 | 3.972 | 3.780 | 481.24 |
| 12 | 3.965 | 3.760 | 483.44 |
| 13 | 3.965 | 3.773 | 481.80 |
| 14 | 3.976 | 3.766 | 483.34 |
| 15 | 3.961 | 3.775 | 481.61 |
| 16 | 3.970 | 3.970 | 483.37
|
| 17 | 3.971 | 3.774 | 482.54 |
| 18 | 3.973 | 3.774 | 482.23 |
| 19 | 3.962 | 3.770 | 3.770 |
| 20 | 3.975
| 3.772 | 483.39 |
| Average | 3.969 | 3.773 | 482.34 |
| Minimum | 3.955 | 3.760 | 481.24 |
| Maximum | 3.977 | 3.780 | 483.44 |
| RMS | 0.006 | 0.005 | 0.69 |
| RMS rel. (%) | 0.14 | 0.12 | 0.14 |
Gauge capability for boron
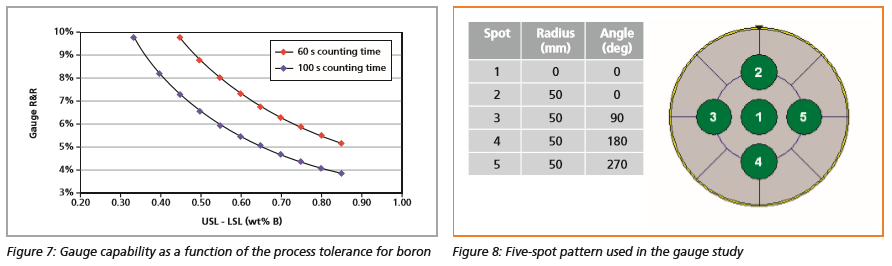
As the determination of the boron concentration is the most demanding step in the XRF analysis of BPSG films, the gauge repeatability and reproducibility (Gauge R&R) is determined for the boron analysis.
Data was acquired by measuring a BPSG film with 3.7 wt% boron, 3.3 wt% phosphorus and a thickness of 250 nm. The wafer was measured using a five- spot pattern according to Figure 7. The
five–spot measurement was repeated 10 times, with the wafer being unloaded after each measurement.
Two counting times were used in this gauge study: 60 s and 100 s per spot. For each measurement spot the standard deviation was calculated. These standard deviations were averaged over all spots. From this average standard deviation S , the measurement variation σm was calculated according to:
S
σm = ___
C4
in which c4 is a statistical unbiasing constant that equals 0.973 for the number of degrees of freedom used in this gauge study.
Consequently, the Gauge R&R is calculated according to:
Gauge R & R =5.15 σm x 100%
Tolerance
The tolerance is defined as the difference between the upper specification level (USL) and lower specification level (LSL). In Figure 7, the gauge capability of the 2830 ZT is plotted as a function of process limits for boron concentration in wt%. Generally the gauge is accepted for Gauge R&R values smaller than 10%.
Long-term reproducibility
The long-term stability of the determination of the boron phosphorus concentration and film thickness was determined by measuring the center spot of a BPSG film with 3.3 wt% boron, 3.6 wt% phosphorus two times per day for five days. The results are shown in Table 3.
| Day/cycle | B (wt%) | P (wt %) | Thickness (nm) |
|---|---|---|---|
| 1/1 | 3.281 | 3.596 | 225.03 |
| 1/2 | 3.275 | 3.598 | 224.71 |
| 2/1 | 3.284 | 3.596 | 224.83 |
| 2/2 | 3.265 | 3.601 | 224.55 |
| 3/1 | 3.27 | 3.615 | 223.60 |
| 3/2 | 3.266 | 3.605 | 224.13 |
| 4/1 | 3.259 | 3.603 | 224.14 |
| 4/2 | 3.271 | 3.599 | 224.73 |
| 5/1 | 3.272 | 3.596 | 224.60 |
| 5/2 | 3.281 | 3.598 | 224.50 |
| MEAN | 3.2 | 3.601 | 224.48 |
| RMS | 0.008 | 0.006 | 0.42 |
| RMS rel. (%) | 0.231 | 0.164 | 0.19 |
The Malvern Panalytical 2830 ZT XRF Wafer Analyzer can analyze BPSG films with excellent precision.
The high sensitivity and system stability allows the 2830 ZT to easily meet gauge capability requirements for measurement times well below 100 s.