This application note shows the possibilities of Empyrean in the field of nanomaterial characterization, by combining SAXS (small-angle scattering), LPA (line profile analysis) and PDF (pair distribution function), also in non-ambient conditions. The Empyrean allows measurements of many types of samples and supports many different applications.
Small-angle scattering is used to determine particle and cluster dimensions and is insensitive to length scales below 1 nm i.e. those comprising small domains and crystal structure. Small-angle scattering is therefore useful in nanotechnologies because it is measuring directly the particle and cluster dimensions that are often most significant in the exploitation of nanoparticle properties.
This application note shows the possibilities of Empyrean in the field of nanomaterial characterization, by combining SAXS (small-angle scattering), LPA (line profile analysis) and PDF (pair distribution function), also in non-ambient conditions. The Empyrean is a truly multipurpose X-ray diffraction (XRD) system which allows measurements of many types of samples: powders, thin films, nanomaterials, metals, solid objects, and supports many different applications, e.g.: phase identification, crystallography, reflectometry, small- angle scattering, PDF, stress, texture, in situ studies in many non-ambient
For crystalline nanoparticles, X-Ray Bragg scattering measures crystal lattice parameters, by virtue of the Bragg peak positions. Information about domain sizes can also be obtained from consideration of the Bragg peak widths (LPA). In the case of perfect nanocrystals, the domain and the particle size can be equivalent (i.e. each particle is a single domain). In this distinct case line profile analysis may additionally provide information about nanoparticle size.
There is an ongoing interest in nanoparticles due to their unique properties that have applications in a range of fields including catalysis, semiconductors, gas storage amongst many others. In this study a variety of distinct analysis techniques were applied on the same in-house X-ray diffractometer. In particular, SAXS, conventional XRD and PDF (total scattering) of nano-sized TiO2 powders were performed, together with in situ heating experiments. The combination of the results from each technique proves to be a powerful tool for a more complete description of the material, providing information about particle and crystallite size, thermal dependence of lattice parameters and phase stability, and local atomic structure (short-range order).
Two TiO2 nanopowders (samples #1 and #2), synthesized by wet- chemical methods and with particle size distributions in the range from 5 to 11 nm, were taken from a Malvern Panalytical kit of verification samples for SAXS. TiO2 is a technologically relevant material, especially as a nanopowder for photocatalytic activity and as UV absorber. The whole work was performed on a Malvern Panalytical Empyrean diffractometer. The PreFIX concept (Pre-aligned Fast Interchangeable X-ray modules) allows for quick and easy exchange of the configurations needed for the various techniques
| Technique 1: SAXS | |
| X-ray tube | Ceramic Cu long fine focus |
| Incident beam optics | Focusing (or parabolic) mirror |
| Sample stage | SAXS/WAXS stage |
| Diffracted beam optics | Programmable anti-scatter slit, Pixcel3D (or X'Celerator) detector |
| Technique 2: XRD for line profile analysis | |
| X-ray tube | Ceramic Cu long fine focus |
| Incident beam optics | Programmable divergence slit |
| Sample stage | Reflection-transmission spinner |
| Diffracted beam optics | Programmable anti-scatter slit, Pixcel3D (or X'Celerator) detector |
| Technique 3: Pair distribution function (PDF) | |
| X-ray tube | Ceramic Ag long fine focus |
| Incident beam optics | Programmable divergence slit |
| Sample stage | Capillary spinner |
| Diffracted beam optics | Fixed anti-scatter, slit X'Celerator detector |
| Technique 4: Variable temperature XRD (VT-XRD) | |
| X-ray tube | Ceramic Cu long fine focus |
| Incident beam optics | Programmable divergence slit |
| Sample stage | Heating stage Anton Paar HTK 1200N with automatic height adjustment |
| Diffracted beam optics | Programmable anti-scatter slit, Pixcel3D (or X'Celerator) detector |
The SAXS technique is ideally suited for the characterization of nanosized materials, and, among others, allows for nanoparticle and pore size analysis and specific surface area determination. In a SAXS experiment, measurements at very small angles are performed, typically in a range from 0.01° to 5° 2θ. In this range are contained data arising from scattering due to electron density modulations in the material with periodic length scales in the range 1 - 100 nanometers. As with other types of scattering there is a reciprocal relationship between the scattering angle and the relevant length scale in the material, the larger length scales giving rise to scattering peaks at lower angles.
The instrument was equipped with a focusing mirror for copper radiation, with a narrow slit to deliver a collimated beam on the sample. The solid-state PIXcel detector (PIXcel3D) was used, characterized by a large dynamic range needed for the measurements. The SAXS measurements, from 0° to 5 °2θ in transmission geometry, were performed as detector scans with a fixed angle of incidence (2θ scan), and the collection time was about five minutes.
The nanopowders were placed between two thin Mylar foils (6 μm) in a holder for a sample stage specifically developed for SAXS.
The scattering curves obtained by SAXS data were analyzed by EasySAXS software. By indirect Fourier transformation the size distribution by volume Dv(R) was calculated. In EasySAXS this calculation can be performed for spherical particles, and does not require any assumption about the shape of the size distribution.
It is worth mentioning that from SAXS data it is not evident whether the main phase is nanocrystalline or amorphous, but this can be easily evaluated from the complementary XRD data.
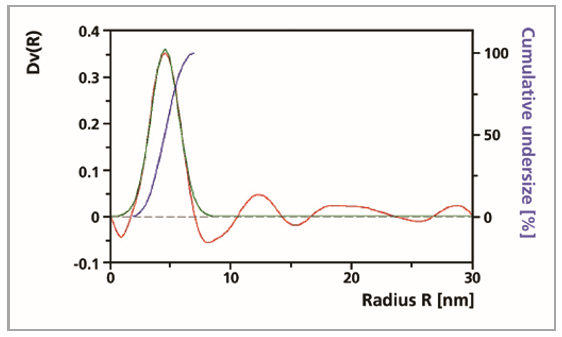
Figure 1. Size distribution averaged on the volume for sample #1 (from the analysis report in EasySAXS)
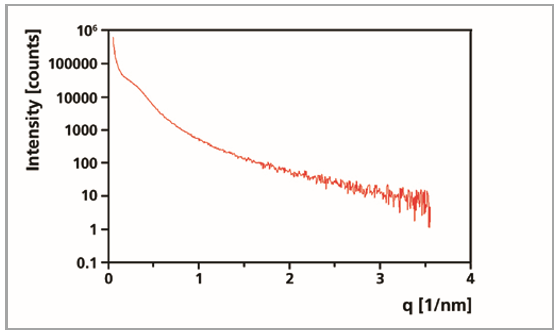
Figure 2. Background-corrected curve for sample #1
| Information gained from SAXS | Sample #1 | Sample #2 |
| Particle size distribution (main phase, crystalline or amorphous) | Particle diameters between 7 and 11 nm (average diameter 9 nm) | Particle diameters between 5 and 9 nm (average diameter 7 nm) |
| Shape of the distributors | Gaussian distribution | Gaussian distribution |
| Specific surface area | 186 m2/g | 251 m2/g |
The diffraction pattern of a material gives the fingerprint of the crystalline phases present in the material under investigation. It is also known that diffraction peaks from nanoparticles become broad as crystallite (domain) size becomes smaller, with subsequent peak overlap and an overall reduction in accuracy. To a certain extent
peak broadening in conventional XRD patterns can be conveniently interpreted to estimate the size of the average crystallite size. Several methods are available in Malvern Panalytical HighScore Plus software: from the
simple Scherrer formula on a single peak to more advanced techniques of line profile analysis (LPA) and full profile fit like Williamson-Hall plot analysis and size-strain determination by Rietveld method.
LPA – Sample preparation
The samples were prepared on zero background silicon sample holders.
LPA – Experimental setup
The Bragg-Brentano geometry (in reflection) was chosen for the line profile analysis. Measurements of the nanopowders and of a well-crystalline standard reference material (silicon NIST powder sample, SRM 640d) were performed with the same setup and scan parameters.
LPA – Results
Williamson-Hall plot approach and the full-pattern Rietveld refinement were used within HighScore Plus. The two methods produced the same value of average crystallite size (~11 nm for nano-anatase in sample #1, and ~8 nm for sample #2)
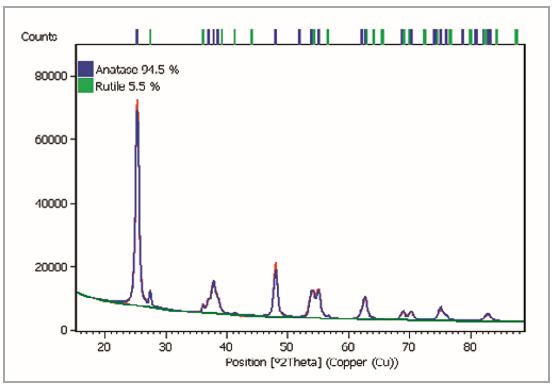
Figure 3: Rietveld refinement of XRD pattern of sample #1
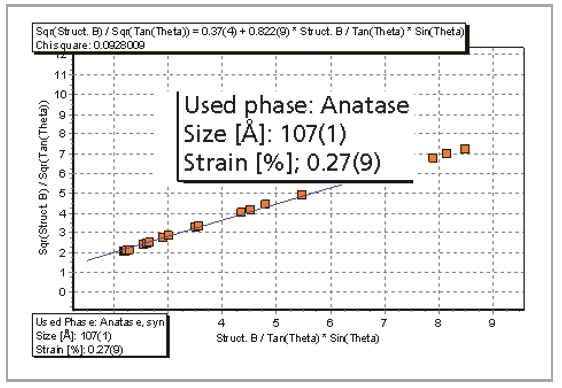
Figure 4: Williamson-Hall plot from profile fitting of XRD pattern of sample #1
| Information gained from XRD | Sample #1 | Sample #2 |
| Phase identification | TiO2 anatase and rutile
| TiO2 anatase |
| Phase quantification | 95% anatase, 5% rutile | 100% anatase |
| Av. crystallite size | - 11 nm (anatase) - 48 nm (rutile) | - 8 nm |
The pair distribution function G(r) describes the probability of finding two atoms separated by a distance r in the sample under investigation. The PDF method extracts structure-related information from powder diffraction data. Since the technique takes both Bragg and diffuse scattering into account, it provides information not only about the long-range (>10 nm) atomic ordering but also about the short-range ordering in materials. This
is the reason why this approach is often called total scattering.
The method is performed in the following steps:
1. The diffraction pattern is corrected for background (using a separate diffraction measurement of an empty glass capillary), Compton scattering, detector dead time, absorption, diffraction geometry and polarization.
2. The corrected X-ray diffraction intensity is scaled into electron units and the structure function is calculated.
3. The structure function is Fourier transformed to obtain the atomic pair distribution function: G(r) = 4πr (ρ(r) - ρ0).
Originally this method was primarily used to study liquids, solid amorphous and highly disordered materials. More recently, it has been used for the analysis of nanostructures and nanoparticles. Since the method requires short wavelengths to obtain high resolution in real space (well- defined interatomic distances) the measurements are often performed at large scale facilities (synchrotrons and neutron sources) making use of both the high flux and energy ranges. We investigated and demonstrated the feasibility to apply the pair distribution function technique on an in-house system, using Ag Kα radiation
A rather short X-ray wavelength is needed to reach a high value of the scattering vector Q (=4πsinθ/λ). A sealed tube with silver anode (wavelength 0.561 Å) was used on the Empyrean system. The main requirements are high intensities and a featureless background: a fixed slits setup was used in combination with a solid-state silicon strip line detector (X’Celerator), and a special anti-scatter kit. Because the intensity quickly decreases at higher angles, the counting time was gradually increased in order to improve the signal at higher 2θ angles. The 24-hour long measurements were 2θ scans starting at 2 °2θ and ending at 150 °2θ, which corresponds to a Qmax of 21.6 Å-1.
The samples were loaded in a glass capillary (with a diameter of 1.0 mm). The capillary geometry allows to reach the highest 2θ angles while keeping the irradiated sample volume constant. A measurement of the empty capillary was also required for the background subtraction.
The data from total scattering experiments were processed using RAD software. By fitting the produced pair distribution function (within PDFgui), it was verified that the interatomic distances of both nanopowders match the ones corresponding to the anatase structure. In other cases local structural distortions of nanoparticles can be found and evaluated, even for amorphous materials which do not produce Bragg peaks.
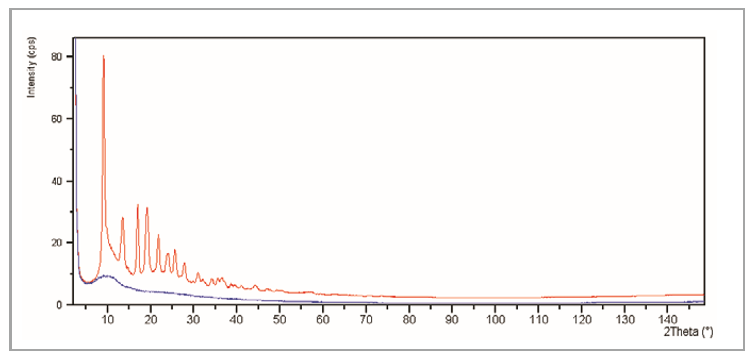
Figure 5. Diffraction patterns with Ag radiation of sample #1 and empty capillary collected to high angle
Anatase is a metastable form of TiO2 that undergoes an irreversible phase transition to rutile. The conversion is time-dependent and has been reported to occur between 400 and 1200 °C, depending on the nature of the starting materials. Therefore studying the structural features during conversion at a particular heating rate provides useful insight into the nature of the starting material.
The study also showed that the nano- anatase in sample #2 is more stable with a transition to rutile about 100°C higher compared to sample #1. This effect confirms what is reported in the literature, where the onset of the transformation anatase to rutile is described as depending also on the particle size and shape. VT-XRD – Experimental setup
The Anton Paar HTK 1200N heating chamber, with motorized z-stage, was used for the in situ XRD study of the thermal evolution of TiO2 nanoparticles. The powder samples were prepared for the experiment in Bragg-Brentano geometry. The main advantage of this chamber is the automatic sample height adjustment to compensate the thermal expansion of the holder. Data were collected up to 950 °C at 10 °C steps, through the phase transition anatase to rutile, and sequentially refined by the Rietveld method in HighScore Plus, making use of a user batch and a script to define the output of the analysis. The results (including wt%, cell parameters and crystallite size) were automatically appended in a spreadsheet to be plotted versus the temperature.
The powders were prepared in the corundum sample holder of the HTK 1200N and measured in reflection geometry.
The study also showed that the nano- anatase in sample #2 is more stable with a transition to rutile about 100°C higher compared to sample #1. This effect confirms what is reported in the literature, where the onset of the transformation anatase to rutile is described as depending also on the particle size and shape.
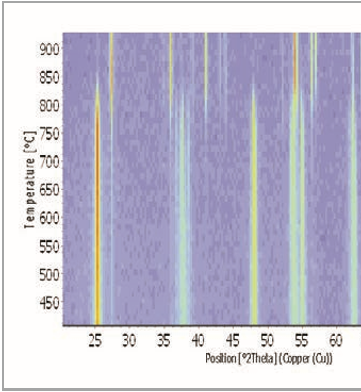
Figure 6. Isoline plot of the variable temperature data set, showing the phase transition from anatase to rutile when heating sample #1 to 950 degrees
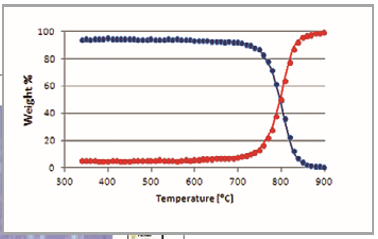
Figure 7. Weight percent from Rietveld refinement (sample #1)
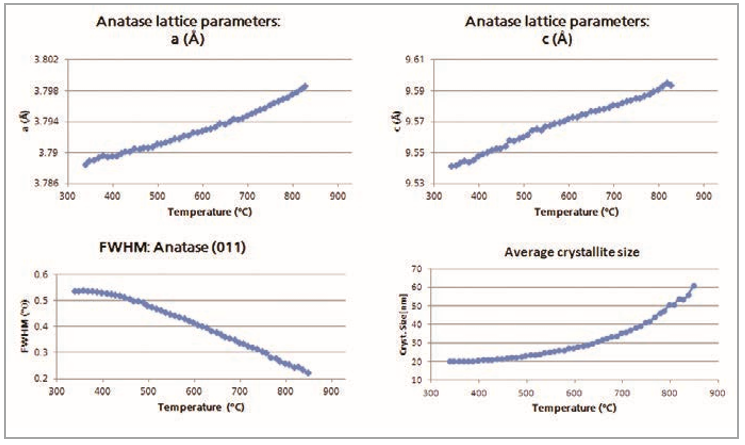
Figure 8. Results of sequential Rietveld refinement of non-ambient data plotted versus temperature: lattice parameters and average crystallite size (sample #1)
This application note shows the variety of complementary techniques available for nanoparticle characterization on a laboratory XRD platform. From conventional XRD at room temperature and non-ambient conditions, to applications like SAXS and PDF (total scattering), which are normally in the domain of dedicated instruments or large-scale facilities, a suitably equipped and multipurpose XRD diffractometer is demonstrated to be capable of the characterization of structure and size of nanoparticles of anatase. In particular, particle size distributions and surface to volume ratios were derived by SAXS data, while XRD provided phase identification, quantification and estimates of crystallite sizes. By making use of a heating stage like Anton Paar HTK 1200N, the thermal trends of such parameters were determined. The local structure was independently confirmed by PDF to be anatase. All characterization information about the material was achievable in-house and within a relatively short time period.
Software used for the analysis:
1. SAXS analysis: Malvern Panalytical EasySAXS
2. LPA, phase quantification, sequential Rietveld refinements: Malvern Panalytical HighScore Plus
3. PDF: RAD, V. Petkov, J. Appl. Cryst. 1989, 22, 387 PDFGui, C.L. Farrow et al., J. Phys.: Cond. Matter, 2007, 19, 335219