The combination of dynamic light scattering (DLS) and Raman spectroscopy has the ability to extract a wealth of chemical, structural, and physical parameters from aqueous protein suspensions. By merging both techniques into one instrument, protein secondary and tertiary structure, along with size changes, can be determined simultaneously from a single experiment on a single small volume sample. Because of its ability to monitor protein structural changes and size changes concurrently, this interleaved technique is particularly useful when studying protein unfolding, as during an unfolding process, the secondary and tertiary structure of a protein change, along with the size.
Here we demonstrate the viability of using a combined DLS/Raman instrument for study of the lysozyme unfolding process as a result of thermal stress. Thermal jump and ramp experiments are performed on lysozyme solutions at pH 4. Raman and DLS results indicate that any protein structural and size changes that occur as the result of increased temperature (up to 80°C) are reversible.
The unfolding and refolding processes of lysozyme under thermal stress conditions are studied with an instrument that combines dynamic light scattering (DLS) with Raman spectroscopy. By combining these complementary techniques, secondary and tertiary protein structural markers (Raman spectroscopy), in combination with size changes (DLS), can be used to more fully understand the unfolding behavior of lysozyme and other proteins.
In these studies, special attention is paid to the amide I (1600 cm-1 - 1700 cm-1), amide III (1200 cm-1 - 1300 cm -1
Malvern Instruments’ Zetasizer Helix (ZS Helix) integrates a fiber-coupled Raman spectrometer with a Zetasizer Nano ZSP to provide DLS (colloidal stability) and Raman (conformational stability) data sequentially on a single sample. The Zetasizer Nano system integrates proprietary non-invasive backscatter (NIBS) detector technology with dynamic (DLS), static (SLS) and electrophoretic (ELS) light scattering to measure the hydrodynamic radius of proteins from 0.3 nm to 10 µm, at concentrations ranging from 0.1 mg/mL to 100 mg/mL, or more. Raman spectra were collected using 785 nm excitation (~280 mW) from 150 cm-1 to 1925 cm-1 at 4 cm-1 resolution. Lysozyme from chicken egg white was prepared at concentrations of 3 mg/mL and 30 mg/mL in a pH 4 citric acid buffer. Sample aliquots (~120 µL) were introduced into the temperature controlled sample compartment using a quartz cuvette with a 3 mm pathlength. The sample compartment temperature can be set from 0 °C to 90°C ± 0.1°C. Thermal jump experiments were performed by taking a DLS measurement and Raman spectrum at a low temperature, quickly increasing the temperature in the sample compartment to a high temperature, performing another DLS and Raman measurement, and then finally returning the temperature in the compartment to the initial low temperature, and acquiring another DLS measurement and Raman spectrum. Thermal ramp studies were conducted by collecting Raman and DLS data at a series of pre-defined 0.1°C to 2°C step-wise temperature increments.
Temperature jump studies were first employed to investigate the reversibility of the unfolding of lysozyme caused by thermal stress (Figure 1). The combination of DLS and Raman data from the thermal jump experiments suggests that lysozyme unfolding occurred, as indicated by the concurrent changes in size and Raman spectral markers, and that these changes are likely reversible.

|
Both sets of parameters studied, Raman and DLS, indicate that when the temperature is jumped from 20°C (represented by the black line) to 80°C (represented by the red line), changes are observed in the protein structure for both the 3 mg/mL (Figure 1A, left) and 30 mg/mL (Figure 1B, left) solutions. The Raman spectra show changes in both secondary (amide I, amide III, and skeletal regions) and tertiary structural markers during heating. When the temperature is reversed to 20°C (represented by the gray line), the observed changes are also reversed. This indicates that structural changes that occur are reversible once the temperature is decreased.
Similarly, the DLS data that was acquired with Raman data from the lysozyme solutions show that when the temperature is increased from 20°C to 80°C, the size of the protein increases from ~4 nm to ~5 nm for the 3 mg/mL lysozyme solution (Figure 1A, right) and from ~4 nm to ~7 nm for the 30 mg/mL lysozyme solution (Figure 1B, right). As expected, the size changes are larger for the higher concentration lysozyme solution, as more protein molecules in solution allow for a higher probability of interaction and possible association. These DLS size changes indicate that the protein is beginning to unfold at the higher temperature, but complete denaturation is not occuring, as this would likely lead to agglomeration and a very large size increase seen by DLS. When the temperature is returned to 20°C, the size data indicates that the diameter of the protein returns to its original ~4 nm for both lysozyme solutions. It should be noted that in both DLS results there are large particles present (> 1 µm). As these large particles are present before the temperature jump (20°C, black lines), they are likely the result of sample preparation, as opposed to the formation of large aggregates. Additionally, their percentage intensity is very small, and their volume intensity is below the detection limit (data included). These DLS results, in combination with the secondary and tertiary structural changes observed in the Raman spectra, indicate that the size and structural changes that occur after incubation of lysozyme at 80°C are reversible.
To further study the structural and size changes that lysozyme undergoes while exposed to thermal stress, temperature ramping studies were performed.
Though the temperature jump studies indicate that the changes undergone by lysozyme while exposed to heat are reversible, temperature ramping studies were also performed to provide more information regarding the temperature at which the changes begin to occur and to provide additional information regarding these structural changes. Temperature ramp studies were performed by collecting DLS and Raman data at each 1°C increment between 20°C and 80°C, and then repeating between 80°C and 20°C.
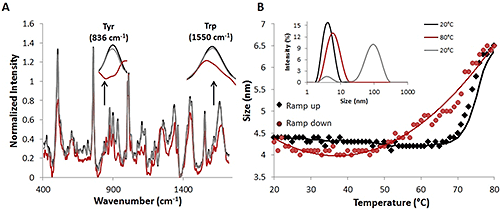
Similar to the temperature jump data, the Raman spectra and the DLS data from the thermal ramping studies indicate that as the temperature increases, there are secondary and tertiary structural changes (Figure 2A) as well as size changes (Figure 2B) in the lysozyme in solution.
The secondary structure protein markers that were noted above for the temperature jump studies (amide I, amide III, and skeletal regions), all show changes as the temperature is ramped from 20°C (black line) to 80°C (red line). These changes indicate a decrease in alpha helical structure with an increase in temperature. The DLS data from the thermal ramping study indicates that as the temperature in the sample compartment is ramped up (black diamonds), the diameter of the protein begins to increase at ~70°C (Figure 2B). From 20°C to 70°C, the diameter of the proteins in solution remains relatively constant just below 4.5 nm. After 70°C, the size begins to increase, and by 80°C, the size is reported as ~6.5 nm. Additionally, obvious changes in the tyrosine and tryptophan bands are observed (Figure 2A, inset), indicating that tertiary structural alterations are occurring. These changes in both the Raman spectral data and the DLS data suggest that both the structure of the protein and its size are changing under thermal stress.
|
Once the temperature is decreased, or ramped down, to the original temperature of 20°C (red circles), the size also decreases back to the original size of ~4.5 nm (Figure 2B). Additional confirmation of this reversibility is provided by comparing the percent intensity distributions at 20°C (black line), 80°C (red line), and 20°C (gray line) (Fig. 2B, inset). When the temperature is ramped back down to 20°C (gray line), there is a large peak present at ~100 nm. DLS, though, is extremely sensitive to size; intensity is proportional to r6 so a very small amount of large particles will appear more intense than smaller particles. In fact, the volume percentage of the large particles is ~0.3% of the total volume of the solution (data not included). These large particles are, therefore, believed to be the result of the increased time it takes to perform a temperature ramp experiment, as they were not present in the jump experiments. Additionally, 30 mg/mL is a high concentration for a protein solution, and this, in addition to the increased experimental time, increases the likelihood of forming larger particles.
The Raman spectral data for the lysozyme also indicate that when the temperature is returned to 20°C (gray line), the structural changes observed when heated are reversed. The Raman spectral data, in combination with the DLS data from the thermal ramping study, again suggest that the protein is partially unfolding, that structural and size changes occur at higher temperatures, and these size and structural changes are reversible.
To further assess the structural changes observed in the Raman data, the α-helix and β-sheet content are analyzed for the characterization of the secondary structural changes that occur during a thermal ramping study.

|
The skeletal region at ~930 cm-1 and alpha helix content are analyzed (Figure 3A). The intensity of the skeletal band is a predictor of α-helix content (Figure 3A, top). As the temperature is ramped up from 20°C to 80°C (black diamonds), the intensity of this marker band begins to decrease, indicating that there is a decrease in the amount of helical content. This decrease begins to occur at ~70°C. Similarly, a PLS model secondary structure predictor also suggests that the α-helix content begins to decrease around 70°C (Figure 3A, bottom), and fitting the curve of the first derivative of the α-helix content to a sigmoid function designates the Tm of the protein to be ~72°C. Both of these graphs show that when the temperature is returned to 20°C (red circles), the helical content returns to its original value.
The amide I peak at ~1660 cm-1 and β-sheet content are also analyzed (Figure 3B). The location of the center of the amide I peak is a predictor of the α-helix/β-sheet content of a protein. As the temperature is ramped up from 20°C to 80°C (black diamonds), the band shifts by ~8 cm-1 to higher wavenumbers. This indicates that the β-sheet content is increasing, while the α-helix content is decreasing. The decrease of α-helix content supports the observations reported in Figure 3A. The PLS secondary structure predictor is also used to predict the change in β-sheet percentage and indicates that as the temperature increases, the β-sheet content also increases slightly. The shift of the peak in the amide I region and the β-sheet predictor both show changes occurring at ~70°C, which agrees with what is observed for the helical changes. Similar to the helical changes, the β-sheet changes are reversible. When the temperature is returned to 20°C (red circles), the percentages return to their original values.
An instrument that combines DLS and Raman spectroscopy was successfully employed to study the reversibility of the start of the unfolding process in lysozyme while exposed to temperature changes at pH 4. Together, the DLS and Raman results suggest that lysozyme was beginning the unfolding process when the temperature was increased, as Raman spectral data indicated that secondary (amide I, amide III, and skeleton) and tertiary (tyrosine and tryptophan) structural markers changed, while DLS data showed that there was an increase in protein size. When the temperature was decreased to the original starting temperature of 20°C, the size and spectral data suggested that the changes seen at the higher temperature were reversed, indicating that the protein was back in its original state, and any unfolding that occurred was reversible. The simultaneous monitoring of two protein characteristics, size and structure, during thermal stress allowed for a more complete picture of the protein behavior during this study.
Malvern Instruments' Bioscience Development Initiative (BDI) was established to accelerate innovation, development and the promotion of new technologies, products and capabilities to address unmet measurement needs in the biosciences markets.