Catalytic materials are important for a wide variety of applications from their use in the chemical industry to the utilization in solar energy production to everyday applications such as automotive catalysts. There are three main types of catalysts; heterogeneous catalysts, homogeneous catalysts, and biocatalysts (enzymes), with heterogeneous catalysts the most studied via X-ray diffraction (XRD). Typically, these types of catalysts consist of solid-state materials such as metals, inorganic compounds, and zeolites which increase the rate of reaction due to the surface binding of reactants. Additionally, homogeneous and biocatalysts can be studied to some extent as well. In the analysis of these substances, it is important to examine structure-performance relationships and identify reaction mechanisms (i.e. the elementary reaction steps, intermediates, and active sites) under technologically relevant conditions. To do so requires an in-depth knowledge of the atomic structure on both the short- and long-range scales.
X-ray diffraction is a technique that can provide information about the average bulk structure of a material based on the interference pattern resulting from the long-range ordering of scattering centers. Using Bragg’s law, XRD allows for the determination of the spacing between scattering planes (d) by measuring the scattering angle (θ) at a fixed wavelength (λ), as shown in Figure 1.
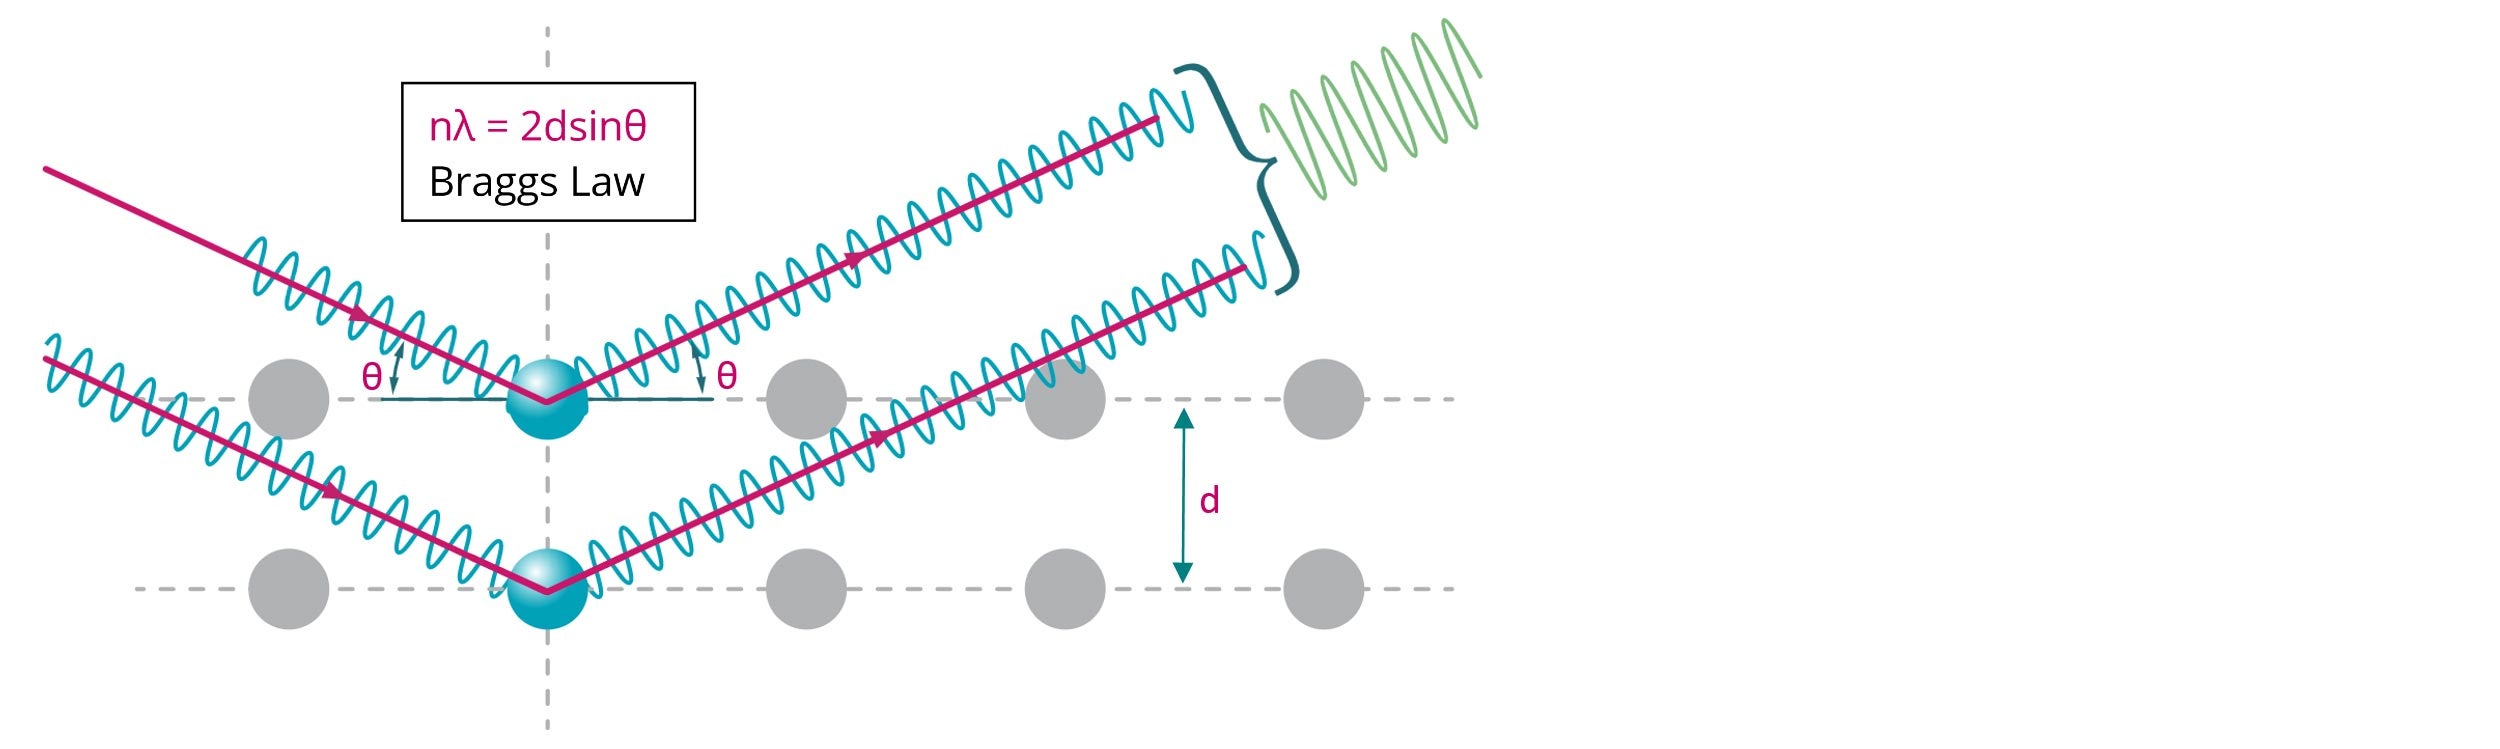
Figure 1: Illustration of Bragg diffraction where two beams with identical wavelength and phase are scattered from two atoms with spacing (d) to give constructive interference (n = 1, 2, 3…)
The observed peaks relate to the symmetry and unit cell dimensions of the material and can be used as a fingerprint for phase identification as well as to provide a quantitative analysis of the sample. Furthermore, examination of the peak breadths, low angle scattering, and inverse Fourier transformation of the reciprocal space data can provide information about particle and crystallite size as well as short-range ordering in the material. Much of this information is obtained via X-ray scattering techniques which do not rely on the presence of long-range order and can be utilized to study nano-sized and amorphous materials.
Malvern Panalytical’s line of X-ray diffraction instruments can aide in the analysis of catalytic materials by yielding the identification and quantification of both crystalline and amorphous phases as well as providing information about particle and crystallite size, micro strain, thermal stability, and local atomic structure (i.e. short- and intermediate-range order). With the use of non-ambient chambers, catalytic materials can be examined under various operating conditions which can aide in understanding reaction pathways and identifying the presence of intermediate phases. Under these conditions it is possible to monitor processes such as oxidation/reduction reactions that contribute to the activation of catalytic materials. Additionally, many catalysts consist of nano sized materials making information regarding the local structure an important aspect of performance optimization. As XRD only provides information related to the bulk structure of materials, it is often necessary to perform additional methods such as small angle X-ray scattering (SAXS) and pair distribution function (PDF) analysis. These techniques allow for the determination of structural information on the nanometer scale (i.e. 1 – 100 nm) which is a pertinent size range for many catalytic materials. In particular, information such as particle size and shape as well as specific surface area (SSA) can be obtained via SAXS measurements while PDF analysis provides information regarding short-range atomic order (i.e. atomic pair correlations) which can give insight into nanocrystalline and amorphous phases as well as local structure variations.
This white paper highlights several techniques that can be performed on Malvern Panalytical’s floor standing and benchtop XRD platforms to assist in the characterization of catalytic materials. With Malvern Panalytical’s Empyrean instrument, which allows for the easy exchange of stages and optics, basic powder X-ray diffraction (PXRD) measurements (i.e. phase identification and quantification) as well as non-ambient, SAXS and PDF experiments can all be performed without the need for re-alignment of the instrument. Additionally, both PXRD and non-ambient measurements can also be performed on the benchtop Aeris instrument which has comparable resolution, scan-times, and peak intensities to the floor standing Empyrean. Data from both instruments can be analyzed via HighScore (Plus) software for phase identification and quantification as well as the analysis of non-ambient and PDF data. Additionally, Malvern Panalytical’s EasySAXS software provides a straightforward method to obtain relevant information from SAXS data.
Catalytic materials are important for a wide variety of applications from their use in the chemical industry to the utilization in solar energy production to everyday applications such as automotive catalysts. There are three main types of catalysts; heterogeneous catalysts, homogeneous catalysts, and biocatalysts (enzymes), with heterogeneous catalysts the most studied via X-ray diffraction (XRD). Typically, these types of catalysts consist of solid-state materials such as metals, inorganic compounds, and zeolites which increase the rate of reaction due to the surface binding of reactants. Additionally, homogeneous and biocatalysts can be studied to some extent as well. In the analysis of these substances, it is important to examine structure-performance relationships and identify reaction mechanisms (i.e. the elementary reaction steps, intermediates, and active sites) under technologically relevant conditions. To do so requires an in-depth knowledge of the atomic structure on both the short- and long-range scales.
X-ray diffraction is a technique that can provide information about the average bulk structure of a material based on the interference pattern resulting from the long-range ordering of scattering centers. Using Bragg’s law, XRD allows for the determination of the spacing between scattering planes (d) by measuring the scattering angle (θ) at a fixed wavelength (λ), as shown in Figure 1.
Figure 1: Illustration of Bragg diffraction where two beams with identical wavelength and phase are scattered from two atoms with spacing (d) to give constructive interference (n = 1, 2, 3…)
The observed peaks relate to the symmetry and unit cell dimensions of the material and can be used as a fingerprint for phase identification as well as to provide a quantitative analysis of the sample. Furthermore, examination of the peak breadths, low angle scattering, and inverse Fourier transformation of the reciprocal space data can provide information about particle and crystallite size as well as short-range ordering in the material. Much of this information is obtained via X-ray scattering techniques which do not rely on the presence of long-range order and can be utilized to study nano-sized and amorphous materials.
Malvern Panalytical’s line of X-ray diffraction instruments can aide in the analysis of catalytic materials by yielding the identification and quantification of both crystalline and amorphous phases as well as providing information about particle and crystallite size, micro strain, thermal stability, and local atomic structure (i.e. short- and intermediate-range order). With the use of non-ambient chambers, catalytic materials can be examined under various operating conditions which can aide in understanding reaction pathways and identifying the presence of intermediate phases. Under these conditions it is possible to monitor processes such as oxidation/reduction reactions that contribute to the activation of catalytic materials. Additionally, many catalysts consist of nano sized materials making information regarding the local structure an important aspect of performance optimization. As XRD only provides information related to the bulk structure of materials, it is often necessary to perform additional methods such as small angle X-ray scattering (SAXS) and pair distribution function (PDF) analysis. These techniques allow for the determination of structural information on the nanometer scale (i.e. 1 – 100 nm) which is a pertinent size range for many catalytic materials. In particular, information such as particle size and shape as well as specific surface area (SSA) can be obtained via SAXS measurements while PDF analysis provides information regarding short-range atomic order (i.e. atomic pair correlations) which can give insight into nanocrystalline and amorphous phases as well as local structure variations.
This white paper highlights several techniques that can be performed on Malvern Panalytical’s floor standing and benchtop XRD platforms to assist in the characterization of catalytic materials. With Malvern Panalytical’s Empyrean instrument, which allows for the easy exchange of stages and optics, basic powder X-ray diffraction (PXRD) measurements (i.e. phase identification and quantification) as well as non-ambient, SAXS and PDF experiments can all be performed without the need for re-alignment of the instrument. Additionally, both PXRD and non-ambient measurements can also be performed on the benchtop Aeris instrument which has comparable resolution, scan-times, and peak intensities to the floor standing Empyrean. Data from both instruments can be analyzed via HighScore (Plus) software for phase identification and quantification as well as the analysis of non-ambient and PDF data. Additionally, Malvern Panalytical’s EasySAXS software provides a straightforward method to obtain relevant information from SAXS data.
Powder X-ray diffraction provides structural information about the phases present in a material. Many samples can contain multiple crystalline phases as well as amorphous phases. With the use of modern day PXRD instrumentation, high quality measurements can be obtained quickly, with good resolution and low background which allows for identification and quantification to be performed on multiphasic systems including the analysis of minor phases. These analyses can be easily performed within Malvern Panalytical’s HighScore Suite [1]. Furthermore, quantification of both crystalline and amorphous phases can be achieved with multiple different methods, such as Rietveld refinement.
Here the supported catalyst material PdO/Fe2O3 (courtesy of TU Vienna, Austria), which is depicted in the inset of Figure 1, was measured over a range of 5 to 90 °2θ. The measurements were performed using the PIXcel3D detector based on Medipix3 technology which allows for fast data collection and, thanks to its pulse height discrimination (PHD) capabilities, also reduces background fluorescence due to the presence of iron within the sample, as the measurement was conducted with a copper source. As can be observed in Figure 2, two Fe2O3 phases (maghemite and hematite) were identified and quantified via Rietveld analysis as 92.6% and 3.9%, respectively. The remaining 3.5% of the sample is identified as PdO with its main peaks observed at approximately 34 °2θ.
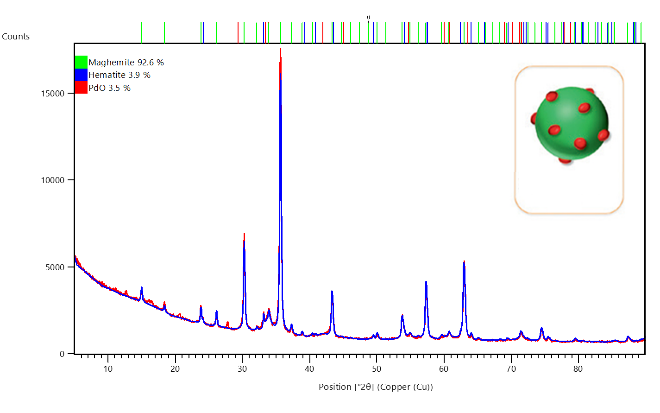
Figure 2: Identification and quantification of phases present in a PdO/Fe2O3 sample using Rietveld refinement, performed within HighScore Suite. Inset: Graphical depiction of material with Fe2O3 support (green) and PdO active sites (red).
For catalytic materials it is also important to examine samples under the conditions at which they will be utilized to determine properties such as thermal stability and the occurrence of phase transitions. Malvern Panalytical’s Empyrean system is compatible with a variety of non-ambient stages which allow for measurements under multiple conditions. The range of measurement conditions across the entire line of stages include variable temperature (-261 to 2000 °C) and humidity (5 to 95 %rH) as well as under vacuum and at elevated pressure (up to 100 bar) within different gaseous environments. In addition to the variety of available conditions, these stages can be quickly exchanged on the instrument using Malvern Panalytical’s PreFIX (Pre-aligned Fast Interchangeable X-ray modules) technology which allows stages to be switched without the need for re-alignment of the instrument. Additionally, the benchtop Aeris instrument has the capability of performing measurements from room-temperature to 500 °C.
In the example below the thermal evolution of pure Fe2O3 as well as PdO/Fe2O3 were monitored in the temperature range of 250 to 800 °C using the Anton Paar HTK 1200N stage on the Empyrean platform. Figure 3a shows a stack plot of the pure Fe2O3 sample over the entire measurement range of 30 to 65 °2θ in which a phase transition from maghemite to hematite can be seen to occur. Examining the main peaks of the two Fe2O3 phases in an isolines plot, shown in Figure 3b, reveals that the phase transition occurs at around 450 °C. Furthermore, Figure 3c shows an isolines plot of the PdO/Fe2O3 sample measured under the same conditions. It can be seen that the primary peak corresponding to PdO in the supported catalyst material is observed to sharpen at approximately 550 °C which indicates an increase in the average crystallite size of PdO and loss of the small surface domains on the support material.
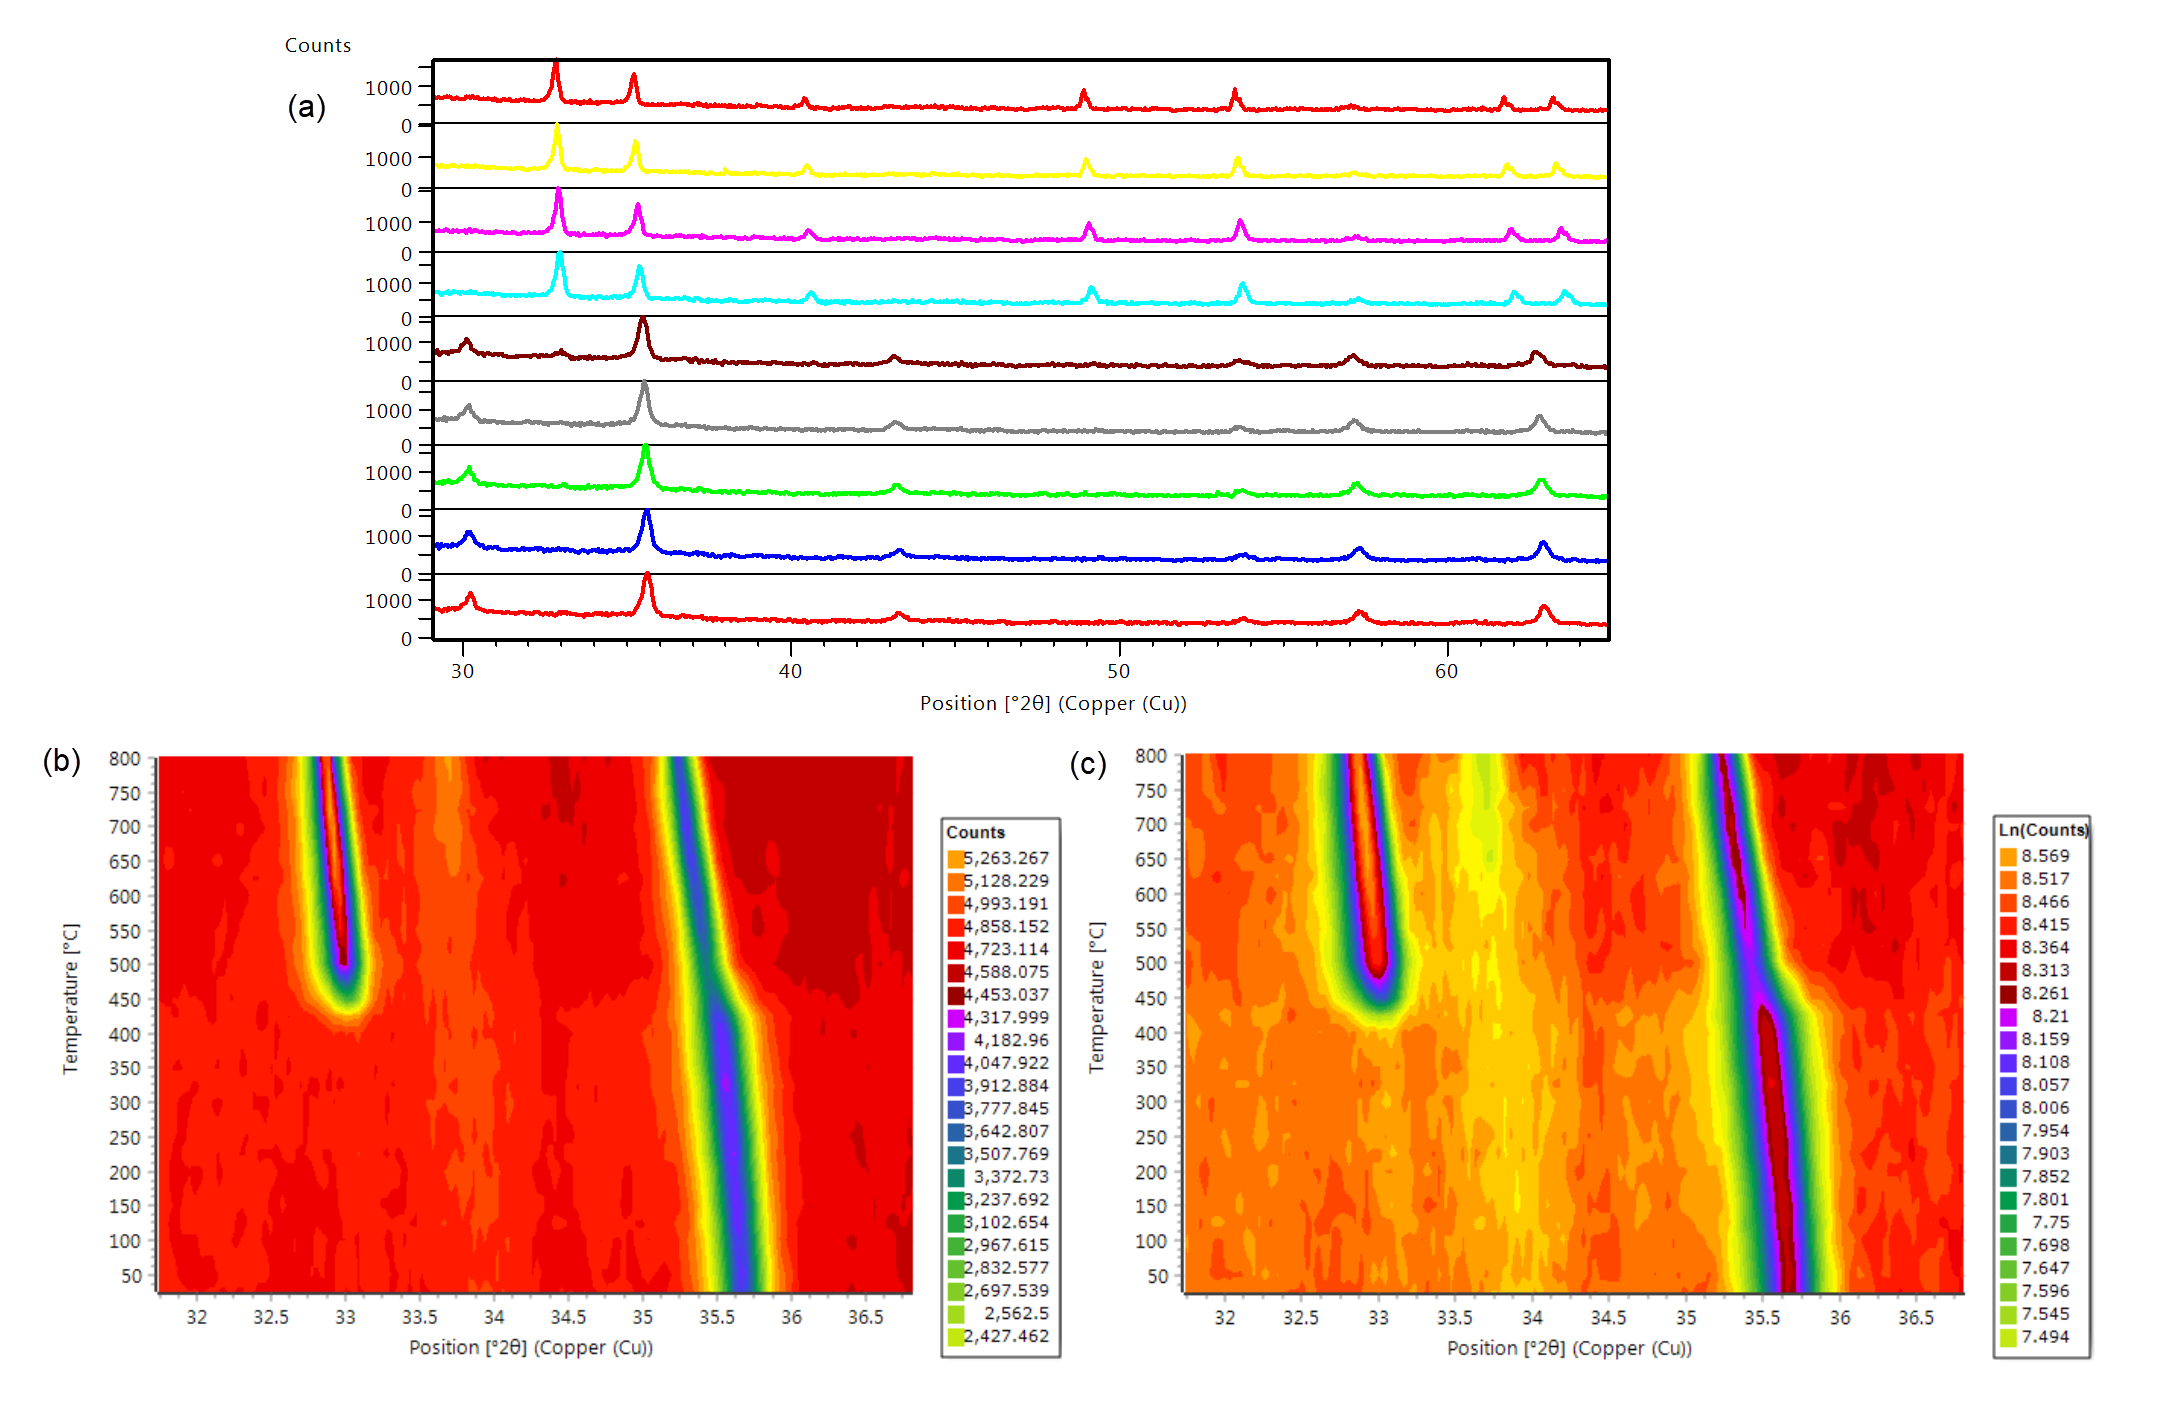
Figure 3: XRD thermal analysis of both pure Fe2O3 and the supported catalytic material PdO/Fe2O3 from 250 to 800 °C. (a) Stack plot of pure Fe2O3, (b) isolines plot of the main peaks of the two Fe2O3 phases, and (c) isolines plot of PdO/Fe2O3.
It is common during non-ambient experiments for many datasets to be collected. To perform analysis in an effective manner, the HighScore Plus software has various tools that can assist in the data reduction process [2]. Figure 4 shows the result of cluster analysis performed on a large number of measurements of nano-titania powder collected at various temperatures over the range of 300 to 1000 °C using the Anton Paar HTK 1200N stage. Cluster analysis is utilized because it allows for an initial screening of the measured data leading to the identification of major groups or clusters with similar characteristics. This technique simplifies the data analysis process by aiding in the recognition of trends contained in the data without the need for an individual analysis of each pattern. In the example below cluster analysis returns three groups which correspond to: (1) pure nano-anatase, (2) an intermediate pattern associated with the phase transition in which both anatase and rutile can be observed, and (3) the crystalline rutile phase. This highlights the ability, in this case, to observe the occurrence of a phase transition in the sample as a function of temperature without having to plot or independently analyze large amounts of data. Furthermore, these processes can be automated using scripting and smart batch features within HighScore Plus which can be programed to provide information such as lattice parameters, peak widths, and crystallite size, as shown in Figure 5, along with quantitative analysis via Rietveld refinement [3,4].
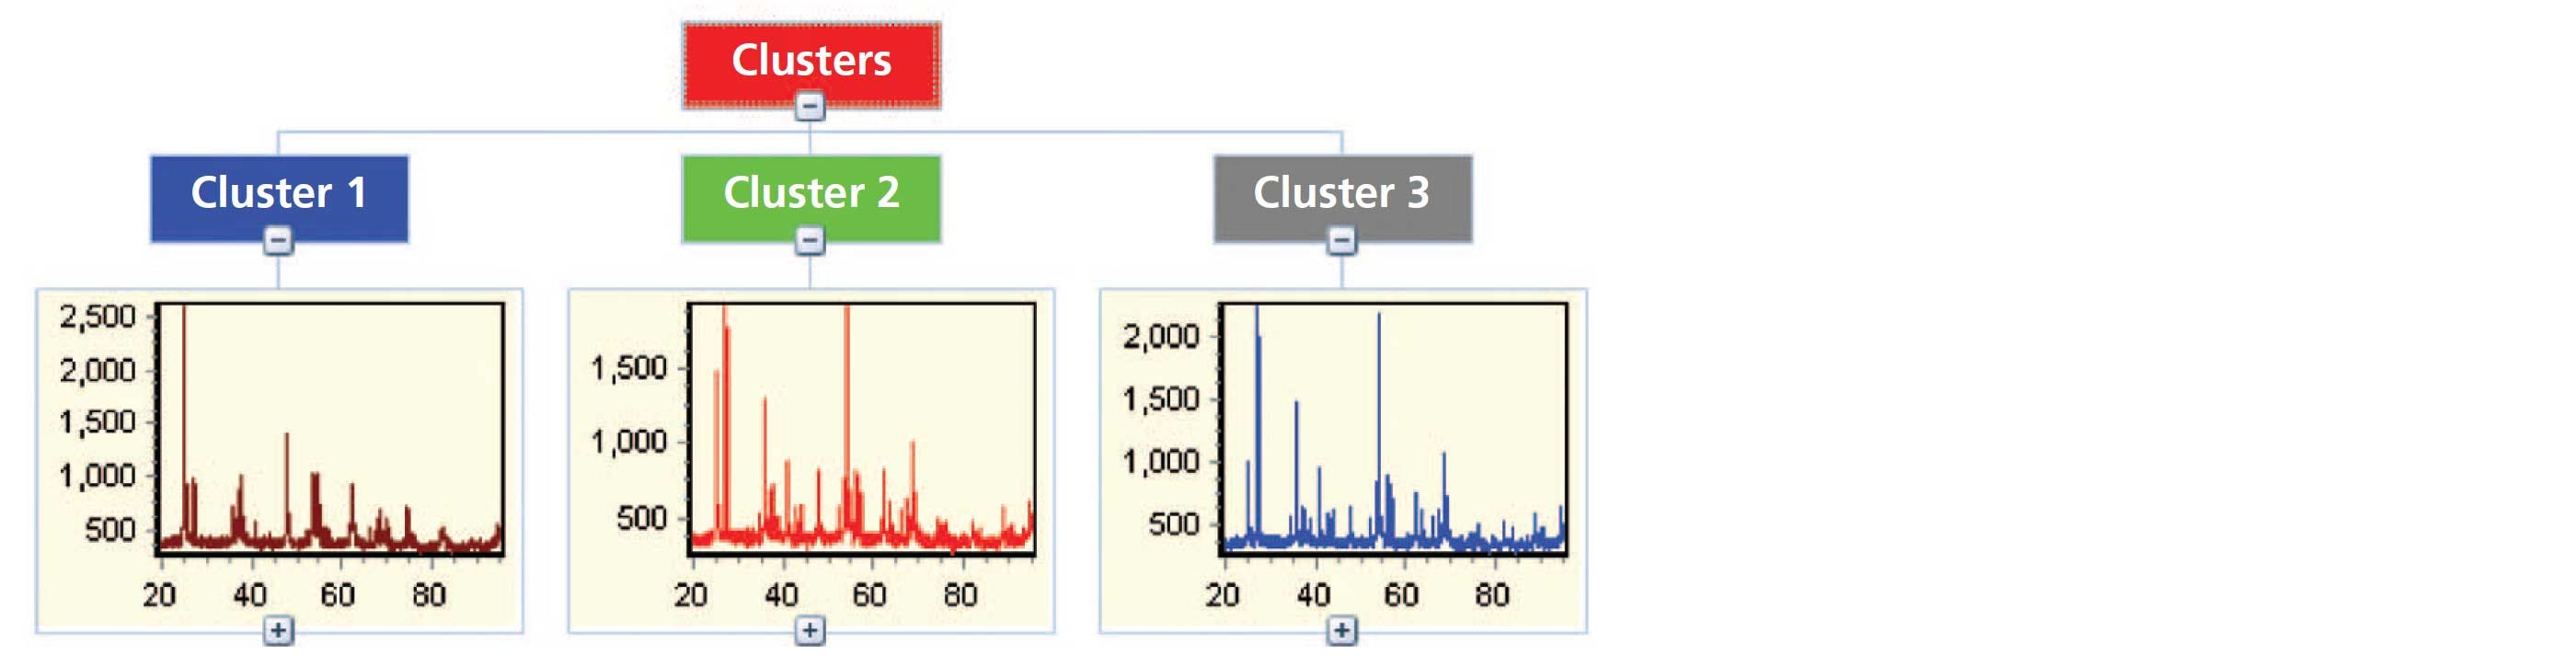
Figure 4: Results of cluster analysis performed on data obtained from variable temperature measurements of nano-titania.
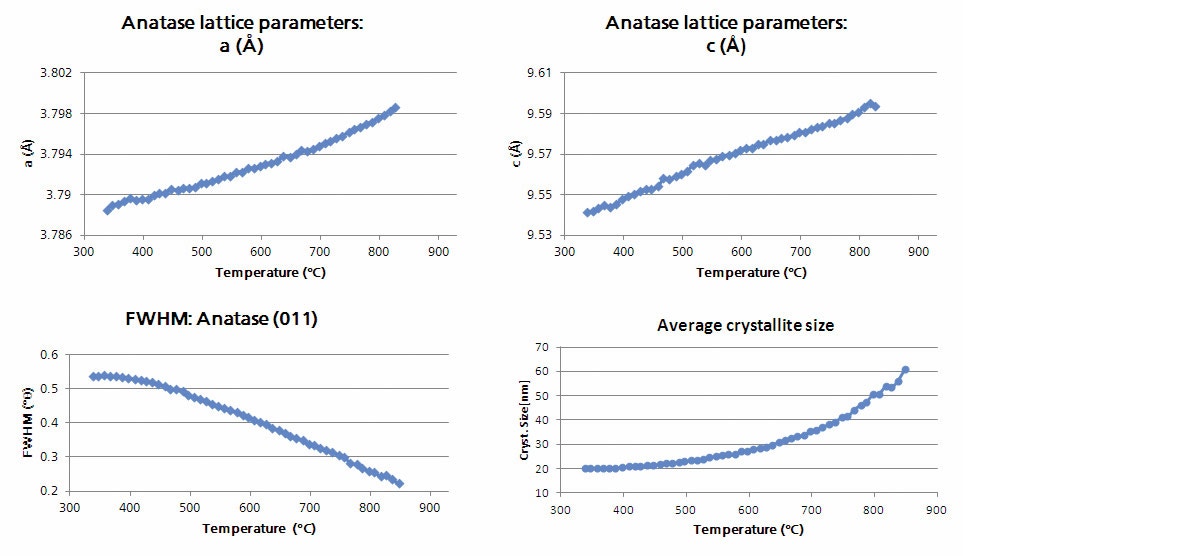
Figure 5: The temperature dependent evolution of the anatase lattice parameters, full width half-max (FWHM) of the (011) diffraction peak, and average crystallite size as determined by Rietveld refinement.
Nano-catalysts are of particular interest because of their high specific surface area and, in the case of supported catalysts, high degree of dispersions of active sites, resulting in a high catalytic activity of the material. The size of the individual particles can be important as it is related to the available surface area on which a reaction to occur. Nanoparticles can exist in hierarchical structures, as depicted in Figure 6. The nanoparticles (P) consist of crystalline or amorphous domains (D) commonly known as crystallites. Additionally, these particles can assemble into larger structures or clusters (C). The individual crystallites are typically studied by methods such as line profile analysis (LPA) or size-strain analysis via Rietveld refinement while particles and clusters are typically examined by small angle X-ray scattering. However, it should be noted that, in the case of a perfect nanocrystal, the particle size will be equal to that of the crystallite, in which case methods such as LPA can be utilized to obtain information related to the particle size.
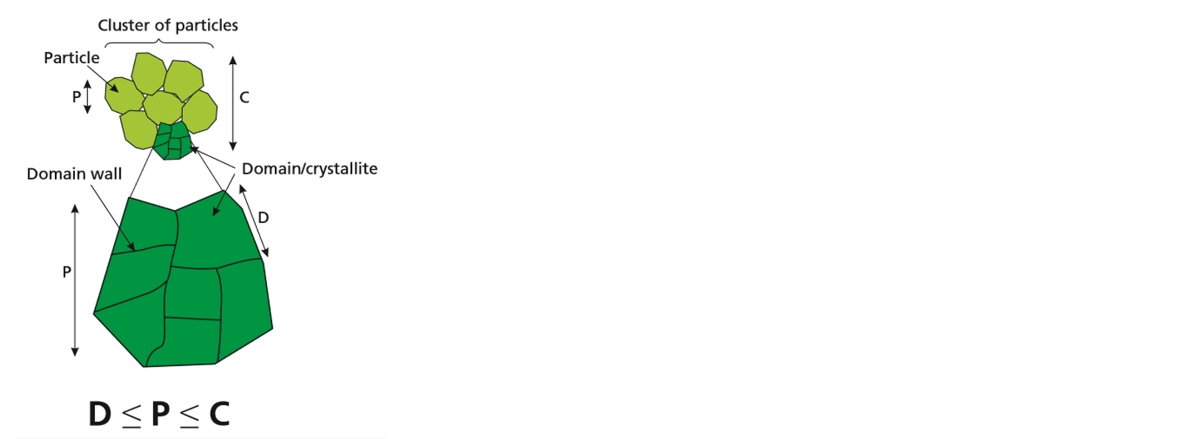
Figure 6: Diagram depicting the hierarchical nature of a typical nanoparticle structure [3].
In addition to being used for phase identification and quantification, PXRD is also commonly utilized to determine the average crystallite size and/or the % micro strain present in a material. This is possible because of the well-known relationship between the breadth of diffraction peaks and the crystallite size or % micro strain in which peaks broaden as the crystallite size becomes smaller or the amount of micro strain increases. It should be noted that while crystallite size is of primary concern for catalytic materials, the micro strain present within the material can also have an effect. HighScore Plus software contains several methods for determining both the average crystallite size and % micro strain based on the observed peak broadening. These range from the simple approach using the Scherrer formula, performed on individual peaks, to more advanced techniques of line profile analysis and full profile fitting such as the Williamson-Hall plot and size-strain determination via the Rietveld method. Figure 7a shows the Williamson-Hall analysis of nano-titania (anatase) measured in the Bragg-Brentano geometry on the Empyrean system [3]. As can be observed, the Williamson-Hall plot is a full-pattern (profile) fitting method that simultaneously provides both the average crystallite size (107 Å) and % lattice strain (0.28 %) in the sample. Additionally, as shown previously in Figure 5, the variation in crystallite size of an anatase sample can also be monitored as a function of temperature via Rietveld refinement. Finally, Figure 7b shows the evolution of crystallite size during the hydrothermal synthesis of nano-ceria. This is observed in the isolines plot as the sharpening of the peak at approximately 28 °2θ as a function of synthesis time. In this case, the value corresponding to the average crystallite size was also determined using the Rietveld refinement method and can be observed in Figure 7c, also plotted as a function of time. It can be observed that the most significant growth occurs in the first 15 hours and the average crystallite size at the end of the 36-hour synthesis is 4.2 nm.
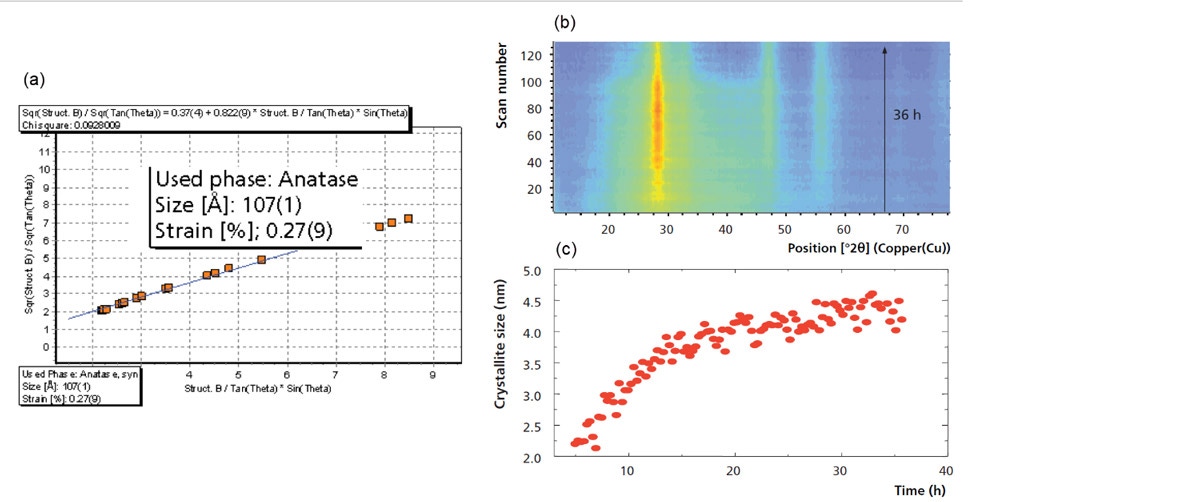
Figure 7: (a) A Williamson-Hall plot obtained from the profile fitting of PXRD data of a nano-titania sample, (b) isolines plot produced from 130 PXRD patterns obtained during a 36 hour synthesis experiment, and (c) trend in crystallite size as a function of synthesis time.
Small angle X-ray scattering can be used to determine particle and pore size, volume-weighted size distribution (DV(R)), and specific surface area of a sample by measuring the scattering due to fluctuations in electron density occurring on a periodic length scale in the range of 1 – 100 nm. In a SAXS experiment, measurements are taken at very small angles (0.01 – 5 °2θ) due to the reciprocal relationship between particle size and scattering angle. As a result, Malvern Panalytical has developed various tools for reducing the low angle background, including the ScatterX78 sample stage, which provides a fully evacuated beam path. Combined with Malvern Panalytical’s EasySAXS software, particle size analysis can be performed quickly and easily [5].
In the example below the data analysis from SAXS measurements of both pure Fe2O3 and PdO/Fe2O3 are observed. Figure 8 shows the volume-weighted size distribution curves as well as the average particle size and specific surface area of both materials. It can be observed that the R50 values for both samples are approximately 20 nm, however, the DV(R) curves indicate a broad size distribution of the particles. Additionally, the specific surface area was determined to be 38.8 and 40.8 m2g-1 for Fe2O3 and PdO/Fe2O3, respectively. This shows that there is a slightly larger SSA with the supported catalyst material due to the active surface sites, as would be expected.
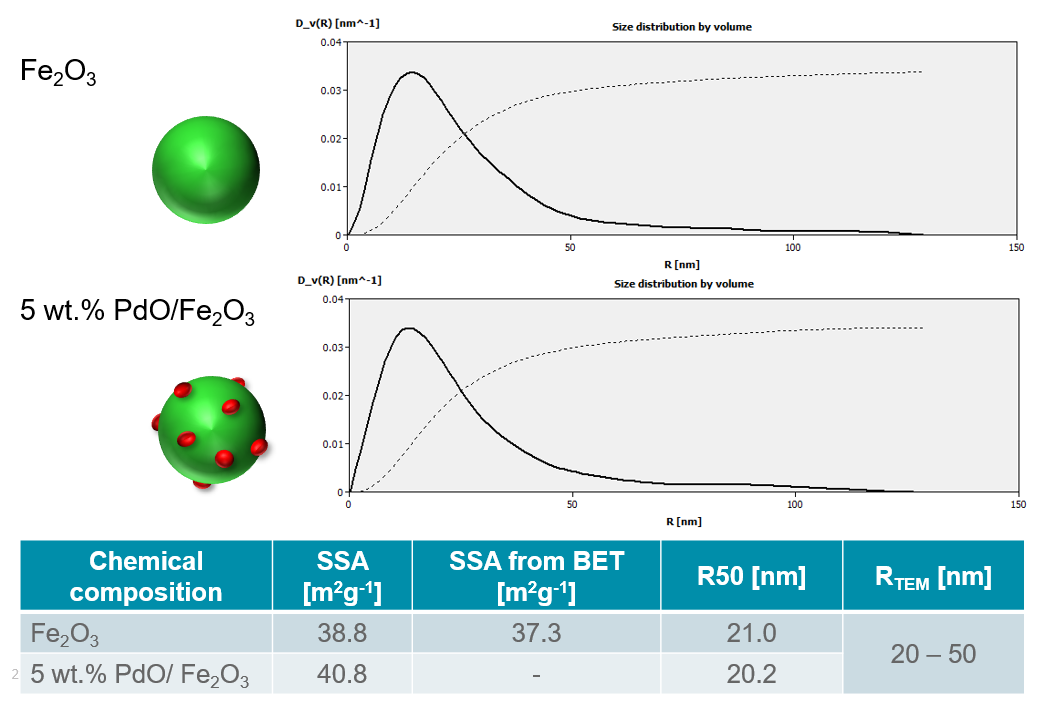
Figure 8: Volume-weighted size distribution curves for Fe2O3 and PdO/Fe2O3 as well as the calculated R50 and SSA values. For comparison, the specific surface area and particle size values were also determined from BET and TEM analysis, respectively (courtesy of TU Vienna, Austria).
X-ray diffraction techniques, resulting in Bragg scattering, provide information related to the long-range order of a crystalline system which is defined by the symmetry of the sample. To obtain information about the local order the method of “total scattering” is utilized which considers not only the Bragg signal but also the diffuse scattering. Additionally, because this method does not assume the presence of periodicity within the sample, it is routinely applied to the study of nanocrystalline and amorphous materials in which the intensity is dominated by broad features. The data obtained from a total scattering experiment can then be Fourier transformed to obtain the so-called pair distribution function. The normalization of the scattering data and subsequent calculation of the PDF can be fully performed within HighScore Plus. The resulting PDF or G(r) describes the probability of finding two atoms separated by a distance r within the material. Figure 9, shown below, depicts the general concept of PDF analysis.
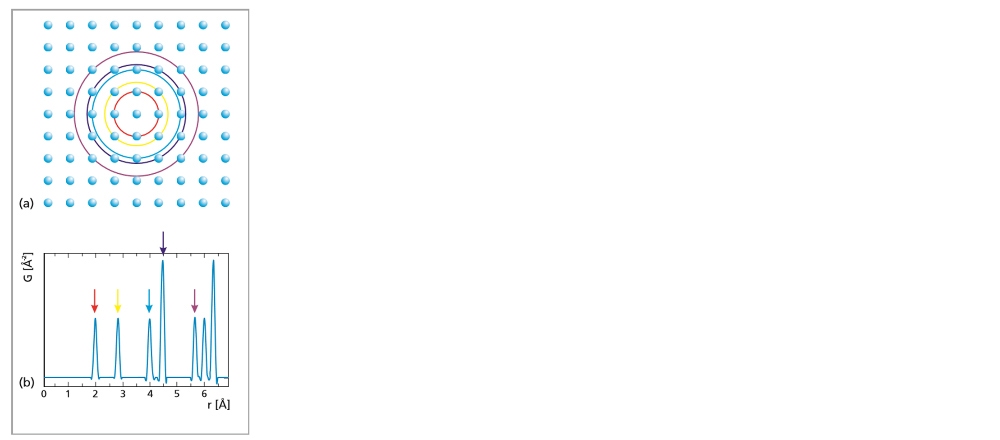
Figure 9: Diagram of an atomic pair distribution function obtained from a 2-dimensional square lattice [6]. The colored circles (a) indicate the distance at which a neighboring atom can be found from a central atom, also known as pair correlations. The arrows indicate the peaks in the PDF (b) that correspond to the various pair correlations.
The resolution of a PDF is dependent on the maximum Q-range that can be obtained in the measurement. This in turn is a function of the wavelength used to collect the data (the shorter the wavelength, the higher the maximum Q-value). As a result, synchrotron radiation has traditionally been utilized for these measurements, however, Malvern Panalytical has developed specific focusing optics for Mo and Ag radiation (with maximum obtainable Q-values of approximately 17 and 21 Å-1, respectively) alongside the GaliPIX3D detector which is 100% efficient with these high-energy radiation sources. As a result, PDF experiments can now be performed on a laboratory-based instrument in a short timeframe with resolution comparable to a synchrotron source [7,8].
In Figure 10, PDF measurements monitoring the hydrothermal synthesis of nano-ceria can be observed [9]. These data were measured on the Empyrean system in a capillary geometry using focusing optics for Mo radiation and the GaliPIX3D detector. As can be seen, during the first 4 hours of synthesis only the short-range Ce-O and Ce-Ce pair correlations (occurring below 5 Å) can be confidently identified above background. However, as the synthesis process continues, the intensity of PDF peaks found at larger radial distances increases and additional ordering within the system becomes evident. Furthermore, a gradual increase in the length of the Ce-Ce pair correlations is also observed.
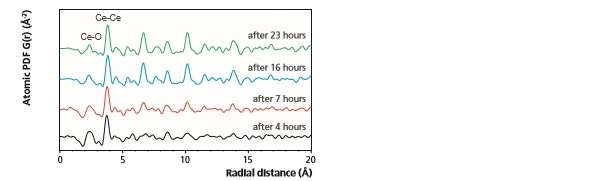
Figure 10: Representative PDFs obtained during the hydrothermal synthesis of nano-ceria.
Figure 11a shows the results of the fitting procedure performed in PDFgui software using the cubic structure of CeO2[10]. As was stated previously, diffraction peaks of nanoparticles can be very broad preventing the accurate determination of lattice parameters. Thus, as observed here, PDF analysis becomes a useful alternative. Utilizing the structural model of the PDF, the CeO2 lattice parameter was determined and plotted as a function of time (Figure 11b). As seen in Figure 11, during the first 15 hours of the synthesis process the CeO2 lattice parameter continuously increases. After 15 hours the lattice parameter remains constant at a value of 5.431(3) Å. This implies that the most active particle growth occurs within the first 15 hours of the synthesis process, mirroring the behavior observed for the crystallite size in Figure 7c.
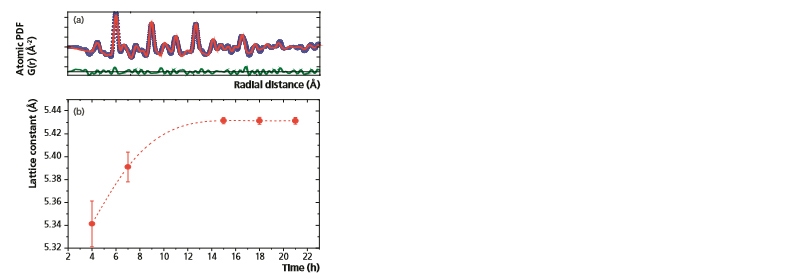
Figure 11: (a) Fit of the experimental PDF to the cubic CeO2 structure using PDFgui software [10]. A good agreement between the experimental (blue circles) and calculated (red line) PDFs is obtained. (b) Variation in the CeO2 lattice parameter as a function of synthesis time.
While PXRD analysis of the supported material PdO/Fe2O3, performed in HighScore Plus, identifies the major phase(s) as Fe2O3, only a single weak peak is observed to indicate the presence of PdO. This suggests that identification and quantification performed by standard PXRD methods is insufficient to unambiguously identify and study the nano sized PdO phase. In this instance, a more advanced application of pair distribution function analysis, known as differential PDF (d-PDF), can be utilized [11]. The method is based on the subtraction of the PDF of pure Fe2O3 from that of PdO/Fe2O3 to isolate the unique pair correlations belonging to PdO. This can be achieved by two different methods: (1) the raw scattering data of the two samples can be directly subtracted immediately following the measurement or (2) subtraction of the individual PDF of Fe2O3 from that of PdO/Fe2O3, it can be shown that both methods give equivalent d-PDFs. Figure 12 shows this concept for total scattering data collected on the Empyrean instrument over and angular range of 3 to 148 °2θ using a focusing mirror for Ag radiation (Q-max of 21.6 Å-1) and a GaliPIX3D detector [8]. The experimentally obtained PDFs of the samples as well as the calculated difference PDF (using method 2) were fit to the structures of Fe2O3 and PdO using PDFgui software [10,12]. This allows for the identification of the Pd-Pd and Pd-O pair correlations that are unique to the catalytically active sites. Additionally, from the decay of the d-PDF it is also possible to estimate the structural coherence length of the PdO particles which were found to be approximately 7.0 nm. This information cannot be obtained by other particle sizing methods such as LPA or SAXS.
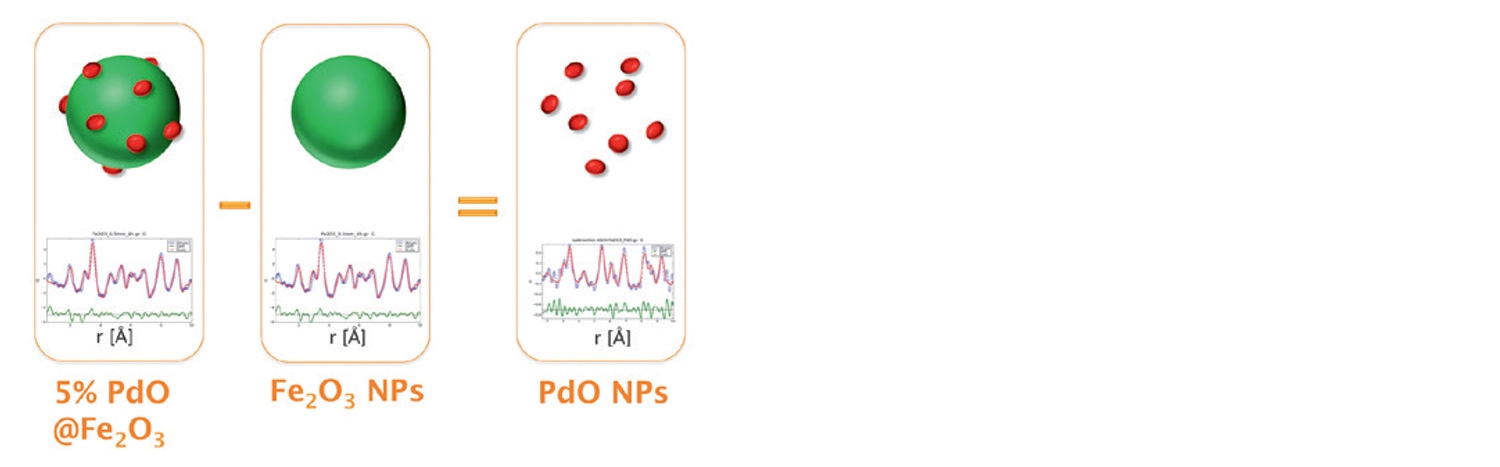
Figure 12: Differential PDF analysis of PdO/Fe2O3 allowing for the isolation of the contribution due to the PdO phase. Fitting of the resulting d-PDF with the tetragonal palladinate structure confirms the isolation of this phase. Even with higher noise, the d-PDF is consistent with the PDF of pure PdO and with the analysis using synchrotron data reported in the literature [13].
The current white paper highlights multiple techniques that can be utilized in the characterization of catalytic materials on the laboratory-based X-ray diffraction platforms available from Malvern Panalytical. The complementary nature of the information obtained by each of the various methods outlined above shows the benefit of utilizing a variety of XRD technologies to gain deeper insight into the materials of interest. The outlined techniques include room temperature and in situ non-ambient measurements, both of which can be performed on the floor standing and benchtop XRD platforms. Powder X-ray diffraction can provide phase identification and quantification as well as estimates of crystallite size and % micro strain. Coupled with non-ambient stages such as those available from Anton Paar, the thermal stability of materials can also be monitored. Additionally, SAXS and PDF measurements, which have traditionally required the use of a synchrotron source or dedicated in-house platform, can be obtained on the Empyrean instrument. As shown, small angle X-ray scattering provides the volume-weighted size distribution and specific surface area of a sample while information about the local structure of both amorphous and nanocrystalline materials can be obtain via PDF analysis. Furthermore, it was shown that the combination of techniques such as non-ambient and PDF can be useful in yielding information such as the evolution of lattice parameters in nanoceria. Lastly, the utilization of advanced data analysis techniques such as differential PDF can provide unique insights particularly for supported catalysts like PdO/Fe2O3.