
Extended X-Ray Absorption Fine Structure (EXAFS)
EXAFS spectroscopy for deeper structural insight

Advanced XANES spectroscopy, without leaving your lab

X-ray absorption near-edge structure (XANES) is the region of an X-ray absorption spectrum closest to an element's absorption edge – typically spanning just below and about 50-100 eV above the edge. XANES is also known as near-edge X-ray absorption fine structure (NEXAFS). However, in practice, NEXAFS more often describes soft X-ray absorption spectra used in surface science and the study of organic and molecular materials, while XANES typically refers to hard X-ray spectra used in coordination chemistry and the study of metal atoms.
XANES is one of the two complementary regions of an X-ray absorption spectroscopy (XAS) measurement. Where extended X-ray absorption fine structure (EXAFS) quantifies an atom’s local structure, XANES is particularly sensitive to the oxidation state, electronic structure, and the local symmetry of the absorbing atom.
XANES is especially powerful as a fingerprinting tool. Because its spectral features are highly reproducible for a given chemical environment, a XANES spectrum can be compared directly against reference standards to determine oxidation state and coordination geometry, often without extensive modeling.
XANES is measured as part of an XAS spectrum. XAS works by directing a tunable X-ray beam toward a sample and scanning across a range of photon energies.
As the incident X-ray energy matches the binding energy of an electron in a specific inner atomic shell, absorption rises sharply. This is known as the absorption edge. At and just below the edge, core electrons are excited into unoccupied states; above the absorption edge, these electrons are ejected from the atom as photoelectrons. Because each element’s absorption edges occur at characteristic energies, XAS is an element-specific measurement technique.
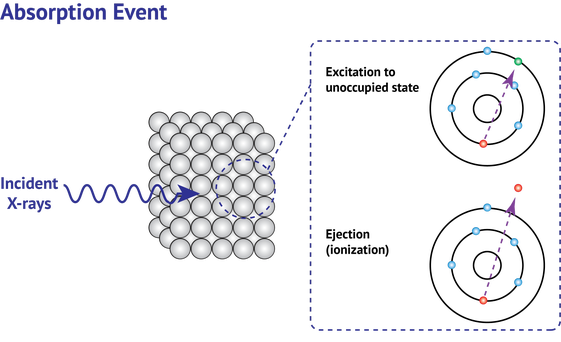
Measuring how strongly the sample absorbs X-rays as the beam scans across the absorption edge yields an XAS spectrum. The region of the spectrum closest to the absorption edge, typically within about 50-100 eV, is the XANES spectrum.
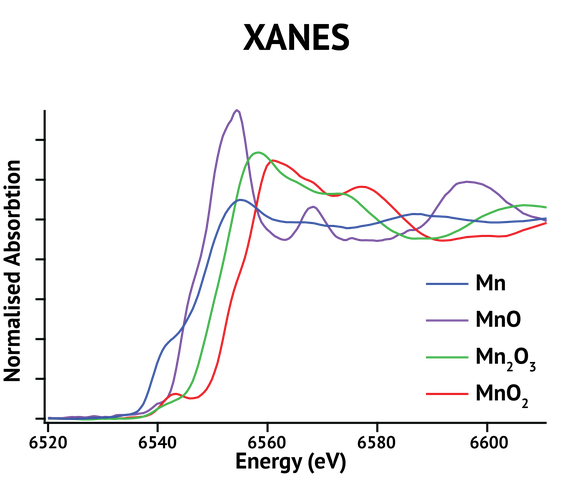
This region contains several diagnostic features. Pre-edge peaks occur when core electrons transition into bound states and are especially sensitive to coordination symmetry. The edge position typically shifts to higher energy as oxidation state increases. Features just above the edge arise from transitions into unoccupied states and multiple scattering of the photoelectron by neighboring atoms. Together, these features are sensitive to the local electronic and geometric environment of the absorbing atom.


Different oxidation states, coordination geometries, and ligand environments each produce a distinct spectral signature. XANES analysis is therefore highly sensitive to:
Because these features depend on how the absorbing atom is bonded to its neighbors, a single XANES spectrum reflects the local chemical environment at the time of measurement. Comparing spectra recorded under different conditions, or against reference standards of known composition, reveals changes in structure or oxidation state as a material evolves.
This makes XANES particularly useful for studying chemical state changes and redox processes, such as those occurring during catalysis or battery charge and discharge cycles.
In surface science, where this same near-edge region is referred to as a NEXAFS spectrum, it is used to characterize organic thin films, polymers, and molecular adsorbates, including the orientation of molecules on a surface.
XANES analysis supports research across a wide range of industries, wherever oxidation state and local coordination control material performance during synthesis, processing, and operation. These include:
XANES identifies the oxidation state and coordination environment of the metal species in a catalyst, and tracks how they shift as a reaction proceeds. Because these changes can be correlated with catalyst activity, selectivity, and stability, XANES is a valuable method for understanding how catalysts work and why they deactivate.
Tracking the oxidation state of cathode and anode materials through charge and discharge cycles reveals how electrode chemistry evolves during battery operation. In situ and operando XANES analysis of these redox transitions helps researchers understand degradation mechanisms and improve battery performance and lifetime.
XANES determines dopant oxidation states and charge compensation mechanisms in functional ceramics, revealing how they influence device performance. This makes it a valuable tool for optimizing materials used in fuel cells, capacitors, and perovskite-based devices.
XANES determines the oxidation state and speciation of metals in soils, sediments, and water. This supports the tracking of contaminants and pollutants, and helps researchers understand how metal species behave in complex natural systems.
The local electronic structure of nanomaterials often differs from their bulk counterparts. XANES characterizes this local chemical environment to help researchers understand the chemical reactivity, catalytic activity, and stability of nanoscale materials.





Add local chemical insight to your multipurpose X-ray platform
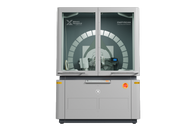
Traditionally, measuring XANES spectra with XAS has required access to synchrotron facilities, where availability is limited and beamtime is highly competitive. Malvern Panalytical’s Empyrean XAS changes this dynamic, bringing XANES measurements directly to the lab.
Empyrean XAS includes:
Empyrean XAS enables researchers to:

Empyrean XAS supports measurements across a wide portion of the periodic table, analyzing K-edges of mid-Z elements (such as Ti, Fe, Ni, and Mo) and L-edges of heavier elements (such as Ba and Ce) – with an accessible energy range of 4–20+ keV.

Empyrean XAS enables laboratory-based XANES and EXAFS measurements, providing local chemical insight that complements traditional X-ray diffraction.
